Demand for oil changes at Garcia's Garage has been as follows: IT Month Number of Oil Changes January February March 39 41 66 April 56 May 67 June 60 July August 66 60 a. Use simple linear regression analysis X= 2; and so on. develop a forecasting model for monthly demand. In this application, the dependent variable, Y, is monthly demand and the independent variable, X, is the month. For January, let X= 1; for February, let The forecasting model is given by the equation Y = +x. (Enter your responses rounded to two decimal places.)
Q: Weekly sales of copy paper at Cubicle Suppliers are in the table below. Compute a three- period…
A: This question is related to the topic -Forecasting and this topic would fall under the business…
Q: Week Actual Forecast Demand 1 52 48 2 42 46 3 56 52 4 45 47 true or false Assume that the actual…
A: The table shows the calculation of forecast of demand using the simple moving average method with 3…
Q: Quesiton-4 Weekly demand for dry pasta at a supermarket chain is as follows (Marks-03) Week…
A: 1. Forecast the demand for week 11 by using a five-period moving average. Average of the past 5 data…
Q: The actual number of patients at Omaha Emergency Medical Clinic for the first sIX weeks of this year…
A: This problem can be solved using the weighted moving average method of forecasting.
Q: The table below shows the demand for a particular brand of microwave oven in a department store.…
A: Given-
Q: Thamer Almutairi, owner of Almutairi's DepartmentStore, has used time-series extrapolation to…
A: Given data
Q: Using an exponential smoothing model with an alpha value of 0.20, estimate the smoothed value…
A: The answer is as below:
Q: Café Michigan's manager, Gary Stark, suspects that demand for mocha latte coffees depends on the…
A:
Q: The following is the actual sales for Manama Company for a particular good: t Sales 17 5 31 The…
A: Given data is
Q: Sales of tablet computers at Ted Glickman's electronics store in Washington, D.C., over the past 10…
A: Error = Actual Demand - Forecast Absolute Error = Positive value of Error MAD = Average of…
Q: Exponential smoothing is used to forecast automobile battery sales. Two value of a are examined, a =…
A: Given information:
Q: Period 1 2 3 4 6. 7 8 9 10 11 12 Sales 568 604 645 742 661 606 749 680 704 736 660 756
A:
Q: The demand (in number of units) for Apple iPad over the past 6 months at BestBuy is summarized…
A: 2-month weighted moving average: Formula: Answer:
Q: 1. Consider the total production (and sales) of ice cream in Canada (in millions of liters) for the…
A: We are authorized to answer three subparts at a time since you have not mentioned which part you are…
Q: George kyparisis owns a company that manufactures sailboats. Actual demand for Georges's sailboats…
A: Given data is
Q: Income at the architectural firm Spraggins and Yunes for the period February to July was as follows:…
A: The formula to be used in Trend smoothing, Tt is Tt+1= Tt + beta*(Ft+1 – FITt)
Q: The following is the Forecasting model for a FOUR season product; the model has been in use since…
A: Regression Analysis Method: The advantage of regression analysis is that it does not consider only…
Q: The Samuel Bridge Company wants to compare the accuracy of three methods that it has used to…
A: Formulas: Error= Actual -Forecast Squared Error = Error2 Mean Square Error (MSE) = ∑Squared ErrorNo.…
Q: Sales of tablet computers at Ted Glickman's electronics store in Washington, D.C., over the past…
A: A) Formulae used : Forecast = (1 - smoothing factor) * Most recent period forecast) + (Smoothing…
Q: Calculate the 2-month Moving Average Forecast for sales from March/2019 to a) January/2019 and enter…
A: Below is the solution:-
Q: A coffee shop owner wants to estimate demand for the next four quarters for hot chocolate. Sales…
A: Given, Quarter 1- 1.20 Quarter 2- 1.15 Quarter 3- 0.77 Quarter 4- 0.88
Q: Consider the following time series data. 2 3 4 5 6 Week 1 Value 19 12 14 10 16 13 (a) Construct a…
A: 3-period moving average forecast (Ft)= At-1+At-2+At-33 Exponential smoothing Forecast…
Q: Consider the total production (and sales) of ice cream in Canada (in millions of liters) for the…
A: Since we only answer up to 3 sub-parts, we will answer the first 3. Please resubmit the question and…
Q: Sales of Volkswagen's popular Beetle have grown steadily at auto dealerships in Nevada during the…
A: MAD(Mean Absolute Deviation) = Sum of absolute deviations/Number of periods
Q: expecting to increase its annual sales for BMW- X5 in year 2021 by 10 % compared to year 2020 annual…
A: The question is related to the sales for 2021 based in the sales of 2020 on quarterly basis. It is…
Q: Use simple exponential smoothing with a -0.8 to forecast electric scooter sales at Guelph- Humber…
A: Given data, MAY 42 JUNE 47 JULY 45 AUGUST 40
Q: Sales of industrial vacuum cleaners at Larry Armstrong Supply Co. over the past I 3 months are shown…
A: Note: As per the Bartleby guidelines only the first three parts have been answered.
Q: Quarterly demand for Ford F150 pickups at a New York autodealer is forecast with the equation:yn =…
A: Given data Where, X= quarters Yn= Quarterly demand Quarter I of year 1 is 0 Quarter II of year 1…
Q: Weekly demand for dry pasta at a supermarket chain is as follows. Week Demands 1 517 2 510 3 557 4…
A: Forecast for 11 weeks with 5 weighted moving average method. Average of recent 5 data (demand) = D10…
Q: The following are sales revenues for a large utility company for years 1 through 11. Forecast…
A: Year ( X ) REVENUE ( Y ) XY X2 1 4875.0 4875 1 2 5065.7 10131.4 4 3 5523.4 16570.2 9…
Q: Café Michigan's manager, Gary Stark, suspects that demand for mocha latte coffees depends on the…
A: Price (x) Number Sold (y) xy x2 $2.70 760 2052 7.29 $3.40 515 1751 11.56 $2.10 990 2079 4.41…
Q: The monthly demand for units manufactured by the Acme Rocket Company has been as follows:Month…
A:
Q: The manager of a travel agency has been using a seasonally adjusted forecast to predict demand for…
A: Mean absolute deviation determines the prediction's accuracy by averaging the specified inaccuracy…
Q: The following are the sales figures for 2018 through 2020 for a product. Data for a year is…
A: An exponential forecasting technique can be expanded to support data with a systematic trend or…
Q: Use the data below to solve for the following: Naïve method Unweighted 3 month moving average…
A: Note: - Since we can answer up to three subparts only, we will answer the first three subparts(first…
Q: A convenience store recently started to carry a new brand of soft drink. Management is interested in…
A: Given data is
Q: 10. Quarterly demand for Jaguar XJ8’s at a Tacloban Auto dealership is forecast with the equation,…
A: Forecasting is used by companies to match supply with demand and to avoid opportunity costs issues.…
Q: My problem asks me to Forecast using a "simple 4-month moving average" but when I calcualte that, I…
A: A) Month Units Sold May 1500 June 1400 July 1800 August 1500…
Q: Forecast the student’s GPA for the fall semester of her senior year by using a three-period moving…
A: Forecasting is a technique used to predict future outcomes on the basis of past data. In businesses…
Q: Income at the architectural firm Spraggins andYunes for the period February to July was as follows:…
A: Foretasted Income at time t Ft= FIT (t−1) +α(A(t−1)−FIT (t−1) ) Trend at time t…
Q: A company sells wielding generators. The demand for periods 1 to 9 is 44,52,50,,54,55,55,60, 56 and…
A: THE ANSWER IS AS FOLLOWS:
Q: The actual number of patients at Providence Emergency Medical Clinic for the first six weeks of this…
A: The weighted moving averages (WMA) are accomplished by multiplying every quantity in the data set…
Q: The forecast for Monday was derived by observing Monday's demand level and setting Monday's forecast…
A: WE ARE GIVEN WITH ACTUAL DEMAND AND FORECAST DEMAND OF MONDAY TO THURSDAY. WE ARE TO FIND FORECAST…
Q: 0. During the past five months the emergency new County Hospital has observed the number of patients…
A: Seasonal adjustment is a strategy for information smoothing that is utilized to foresee monetary…
Q: Consider the following time series data. Week 1 2 3 4 5 6 Value 19 14 16 12 17 15 A. Develop the…
A:
Q: Consider the following set of time series sales data for a growing company over the past 8 months:…
A: Formula: Answer:
Q: The actual demand for the patients at EYE OPD of KTH for the first six weeks of this year follows…
A: Given data is
Q: A concert promoter is forecasting this year's attendance for one of his concerts based on the…
A: Given values, Year Attendance Four years ago 9,000 Three years ago 16,000 Two years ago…
Q: a Compute MAD for the results of each forecasting method. Which one is more accurate? b Compute MSE…
A: Forecasting is a technique used to predict future outcomes on the basis of past data. In businesses…
Q: Sales of Volkswagen's popular Beetle have grown steadily at auto dealerships in Nevada during the…
A:
I really need help. It is due today
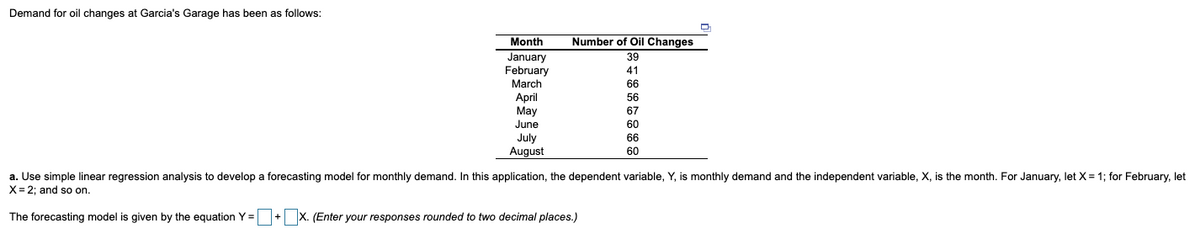
Trending now
This is a popular solution!
Step by step
Solved in 2 steps with 2 images
- The Baker Company wants to develop a budget to predict how overhead costs vary with activity levels. Management is trying to decide whether direct labor hours (DLH) or units produced is the better measure of activity for the firm. Monthly data for the preceding 24 months appear in the file P13_40.xlsx. Use regression analysis to determine which measure, DLH or Units (or both), should be used for the budget. How would the regression equation be used to obtain the budget for the firms overhead costs?The file P13_42.xlsx contains monthly data on consumer revolving credit (in millions of dollars) through credit unions. a. Use these data to forecast consumer revolving credit through credit unions for the next 12 months. Do it in two ways. First, fit an exponential trend to the series. Second, use Holts method with optimized smoothing constants. b. Which of these two methods appears to provide the best forecasts? Answer by comparing their MAPE values.The file P13_29.xlsx contains monthly time series data for total U.S. retail sales of building materials (which includes retail sales of building materials, hardware and garden supply stores, and mobile home dealers). a. Is seasonality present in these data? If so, characterize the seasonality pattern. b. Use Winters method to forecast this series with smoothing constants = = 0.1 and = 0.3. Does the forecast series seem to track the seasonal pattern well? What are your forecasts for the next 12 months?
- Suppose that a regional express delivery service company wants to estimate the cost of shipping a package (Y) as a function of cargo type, where cargo type includes the following possibilities: fragile, semifragile, and durable. Costs for 15 randomly chosen packages of approximately the same weight and same distance shipped, but of different cargo types, are provided in the file P13_16.xlsx. a. Estimate a regression equation using the given sample data, and interpret the estimated regression coefficients. b. According to the estimated regression equation, which cargo type is the most costly to ship? Which cargo type is the least costly to ship? c. How well does the estimated equation fit the given sample data? How might the fit be improved? d. Given the estimated regression equation, predict the cost of shipping a package with semifragile cargo.The owner of a restaurant in Bloomington, Indiana, has recorded sales data for the past 19 years. He has also recorded data on potentially relevant variables. The data are listed in the file P13_17.xlsx. a. Estimate a simple regression equation involving annual sales (the dependent variable) and the size of the population residing within 10 miles of the restaurant (the explanatory variable). Interpret R-square for this regression. b. Add another explanatory variableannual advertising expendituresto the regression equation in part a. Estimate and interpret this expanded equation. How does the R-square value for this multiple regression equation compare to that of the simple regression equation estimated in part a? Explain any difference between the two R-square values. How can you use the adjusted R-squares for a comparison of the two equations? c. Add one more explanatory variable to the multiple regression equation estimated in part b. In particular, estimate and interpret the coefficients of a multiple regression equation that includes the previous years advertising expenditure. How does the inclusion of this third explanatory variable affect the R-square, compared to the corresponding values for the equation of part b? Explain any changes in this value. What does the adjusted R-square for the new equation tell you?The file P13_28.xlsx contains monthly retail sales of U.S. liquor stores. a. Is seasonality present in these data? If so, characterize the seasonality pattern. b. Use Winters method to forecast this series with smoothing constants = = 0.1 and = 0.3. Does the forecast series seem to track the seasonal pattern well? What are your forecasts for the next 12 months?
- A small computer chip manufacturer wants to forecast monthly ozperating costs as a function of the number of units produced during a month. The company has collected the 16 months of data in the file P13_34.xlsx. a. Determine an equation that can be used to predict monthly production costs from units produced. Are there any outliers? b. How could the regression line obtained in part a be used to determine whether the company was efficient or inefficient during any particular month?The file P13_02.xlsx contains five years of monthly data on sales (number of units sold) for a particular company. The company suspects that except for random noise, its sales are growing by a constant percentage each month and will continue to do so for at least the near future. a. Explain briefly whether the plot of the series visually supports the companys suspicion. b. By what percentage are sales increasing each month? c. What is the MAPE for the forecast model in part b? In words, what does it measure? Considering its magnitude, does the model seem to be doing a good job? d. In words, how does the model make forecasts for future months? Specifically, given the forecast value for the last month in the data set, what simple arithmetic could you use to obtain forecasts for the next few months?The file P13_26.xlsx contains the monthly number of airline tickets sold by the CareFree Travel Agency. a. Create a time series chart of the data. Based on what you see, which of the exponential smoothing models do you think will provide the best forecasting model? Why? b. Use simple exponential smoothing to forecast these data, using a smoothing constant of 0.1. c. Repeat part b, but search for the smoothing constant that makes RMSE as small as possible. Does it make much of an improvement over the model in part b?
- The management of a technology company is trying to determine the variable that best explains the variation of employee salaries using a sample of 52 full-time employees; see the file P13_08.xlsx. Estimate simple linear regression equations to identify which of the following has the strongest linear relationship with annual salary: the employees gender, age, number of years of relevant work experience prior to employment at the company, number of years of employment at the company, or number of years of post secondary education. Provide support for your conclusion.The file P13_22.xlsx contains total monthly U.S. retail sales data. While holding out the final six months of observations for validation purposes, use the method of moving averages with a carefully chosen span to forecast U.S. retail sales in the next year. Comment on the performance of your model. What makes this time series more challenging to forecast?Stock market analysts are continually looking for reliable predictors of stock prices. Consider the problem of modeling the price per share of electric utility stocks (Y). Two variables thought to influence this stock price are return on average equity (X1) and annual dividend rate (X2). The stock price, returns on equity, and dividend rates on a randomly selected day for 16 electric utility stocks are provided in the file P13_15.xlsx. Estimate a multiple regression equation using the given data. Interpret each of the estimated regression coefficients. Also, interpret the standard error of estimate and the R-square value for these data.