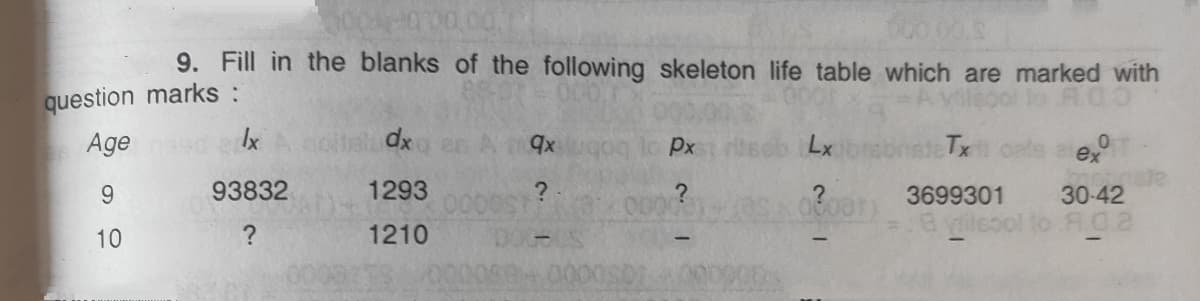
9. Fill in the blanks of the following skeleton life table which are marked with question marks : Age Ix dx Px Lx ateTx ex 9. 93832 1293 3699301 30-42 10 1210


Q: Suppose that the lifetime of Badger brand light bulbs is modeled b bution with (unknown) parameter…
A: It is given that the lifetime of Badger brand light bulbs is modelled by an Exponential distribution…
Q: A die was rolled 360 times and the results were: No. of Spots (outcomes) Frequency 1 54 2 70 3 58 4…
A: Given : significance level,α= 0.05
Q: A researcher studies water clarity at the same location in a lake on the same dates during the…
A:
Q: Question 3 cide if the amount outlined below is a statistic or a parameter: e proportion of male…
A:
Q: Table 2-2 Wafers Classified by Contamination and Location Number of Contamination Particles Center…
A: Given, A: event that a wafer contains 4 or more particles. B: event that a wafer is from centre of…
Q: EXT Shape Media Comment The following Table gives the age-specific fertility rates observed in…
A: Given: Consider the provided table which shows observed age-specific fertility rates in different…
Q: Given the following portion of a life table x| lx Px 0.875 1 1000 2 0.25 3 750 4 5| 200 120 20 20…
A: We know that, for a clinical life table, if Ix ,dx ,qx and px are number alive at the beginning of…
Q: Fill in the blanks of the following skeleton life table which are marked with question marks: Age Ix…
A:
Q: a. Fill the following table and provide evident that you ask 6 students. ent # 1 2 3 4 4 2 2.5 1.5…
A: X (x-xbar)^2 0 5.444444 1 1.777778 1.5 0.694444 2.5 0.027778 4 2.777778 5 7.111111
Q: Consider the following time series data: Year Value 1 234 2 287 255 3.
A: GIven, α = exponential smoothing coefficient Forecast, Ft = Ft-1 + α(At-1 - Ft-1) where, At =…
Q: # Of ID Weight Systolic Pressure 1 120 126 145 120 3 118 128 4 162 129 106 119 143 136 • Weight –…
A: Mean : In statistics , mean is the average of number of observations. Average is the sum of…
Q: A researcher studies water clarity at the same location in a lake on the same dates during the…
A: The random variable depth follows normal distribution. There are two dependent samples which are…
Q: The weight of a newborn is an example of O Quantitative discrete O Qualitative ordinal O Qualitative…
A: It is given that the statement about to the type of data variable. Here, need to find out the…
Q: Which of these describes the population parameter? O A. X = 157 OB. X= 165 OC. μ = 165 OD. U = 157
A: It is given that Population mean = 157 Population standard deviation = 25 Sample mean = 165 Sample…
Q: However, the rate of metal removal is also related to the hardness of the test specimen. Five c aken…
A:
Q: Find the mean engine displacement (in cubic centimetres) for the cars in a parking lot. Displacement…
A: Given that, the senior soccer team includes students from all grades but most of its members are…
Q: se the following information from a st study investigating the relationship b Fillions of dollars)…
A: Given, r 2= 0.87, se =141.9, The regression equation y^ = 199.5x + 56.0. Slope = 199.5 intercept…
Q: According to the information given in Table: Number Interval Age (x), of centres employees (x) (f),…
A:
Q: Data collected at the same time or approximately the same point in time are called Select one: a.…
A: The quantitative data contains the values of numerical measures or counts. The qualitative data…
Q: Match each decimal value with their appropriate percent value. 0.03 DRAG & DROP THE ANSI 1.3 3% 0.4…
A:
Q: 6 months with a standard de nce to conclude that the groce esos every 6 months at a = 5
A: Hypothesized Population Mean =4200042000 Population Standard Deviation = 52005200 Sample Size = 20…
Q: The following data were collected in the study described in Problem 1 relating hypertensive status…
A: Given information: The data represents the values of hypertensive status measured at baseline to…
Q: A researcher studies water clarity at the same location in a lake on the same dates during the…
A:
Q: Question 5 The mean monthly salaries paid to 100 employees of a company were tk. 5000. The mean…
A: Given : The mean monthly salaries paid to 100 employees of a company were to.5000. The mean monthly…
Q: Based on the information provided: 1. Calculate a point estimate for the true population average…
A: Ans. Here it is given that , Sample Size = n = 64 and average unemployment…
Q: Carbon Monoxide Tar (mg) weight (g) 13.6 14.1 0.9853 16.6 16 1.0938 23.5 29.8 1.165 10.2 8 0.928 5.4…
A: Given Information:
Q: Beverage Sales Temperature Sales s 85 1,810 90 4,825 79 438 82 775 84 1,213 96 8,692 2,356 88 76 266…
A: Hey there! Thank you for posting the question. Since your question has more than 3 parts, we are…
Q: A sample found at a dig site was determined to have 68.7% of the C-14 still remaining. Use the model…
A: Consider the equation as shown below: Here, the model Qt =Q0e-0.000121t And the object is to…
Q: Volcano Eruption Data Approximate Number of Eruptions Since 2200 B.C. (unless otherwise indicated)…
A: The data is mainly classified into 2, primary data and secondary data. Primary data is the data that…
Q: The Shroud of Turin, which shows the negative image of the body of a man who appears to have been…
A: To Determine -
Q: (b) Given an effective discrete periodic rate of 4% per period, tabulate the values of am for n =…
A: Given an effective discrete periodic rate of 4% per period.
Q: QUESTION 3 Fill in the table below: df MS F Source of Variation SS Between 40 groups Within 30…
A: Given : ANOVA Table
Q: Copper Iron Zinc Magnesium Calcium Males, epileptic 14 6 211 329 947 Males, nonepileptic 200 960 19…
A: Given data: Copper Iron Zinc Magnesium Calcium Males, epileptic 14 6 211 329 947 Males,…
Q: The following data are the viscosity measurements for a chemical product observed hourly (read down,…
A:
Q: ug in ribution of the number of accidents in 150 weeks. Number of Accidents 0 |Observed frequency 1…
A: Frequency distribution of the number of accidents Number of Accidents Observed Frequency 0 50…
Q: Grand mean=14.82 Calculate effect size using the formula d=(M-u)/
A: Analysis of variance is a useful inferential statistic.
Q: The geyser Old Faithful in Yellowstone National Park alternates periods of eruption, which typically…
A: Solution-: Given: Class width =5 and use 55 as the lower class limit for the first class We want to…
Q: QUESTION 1 Using the z-table, determine the z-score that corresponds to a cumulative area of 0.5948.
A: Answer of Q.1) We need to determine the z-score that has an area of 0.5948 to it's left. By using…
Q: Find the critical value tc for a 90 % Con fidence level
A: From the given information, The sample size is 24. degrees of freedom=24-1=23 Given confidence level…
Q: 8 5 1009 9 003 2 1 7 00004 2 0 0 0 00 0 0000 0 0 A = lar values does A have?
A: Follow the steps.
Q: Calculate the surface temperature of the sun based on its emission spectrum 1200 1000 800 600 400…
A: From the diagram we see that the peak wavelength of solar spectrum is obtained approximately at 500.…
Q: CMNO4 1.00 ppm 2.50 ppm 5.00 ppm 7.50 ppm 10.00 ppm 15.00 ppm 20.00 ppm 25.00 ppm unknown Absorbance…
A: Solution: Let X be the CMnO4- and Y be the absorbance at 580 nm. From the given information,
Q: Like hurricanes and earthquakes, geomagnetic storms are natural hazards with possible severe impact…
A: Given that, the 25 readings of proton flux in the 47-68 KEV range (units are in p/ (cm2…
Q: Preview File Edit View Go Tools Window Help Fri Apr 23 12:34 AM Adobe Scan Apr 23, 2021.pdf Page 3…
A:
Q: I've created a Correlation Matrix in Microsoft Excel. I need to identify 4 pairs of variables that…
A: Consider the example of the dataset is given below:
Q: A part of the Life Table of a population is given hereunder with incomplete information. Find those…
A:
Q: S.N Temperature Humidity Yield 40 57 112 2 45 54 118 50 54 128 4 55 60 121 60 66 126 65 59 136 7 70…
A: Solution (d)
Q: of a certain tumour weight (in
A: Let us assume x and y be the tumour weights of the existing and new treatment respectively.…
Q: Use the figure below to answer these questions. Global Average Temperature 1.0 0.8 Annual mean…
A: Given : A graph showing Temperature vs Baseline on y-axis and 30 year timeline on y-axis.
Q: In California, we need more rain to sustain the health of our natural environment, argriculture, and…
A:


Trending now
This is a popular solution!

Step by step
Solved in 3 steps with 3 images

- Kaitlyn measures the upload speed in megabits per second of her home broadband internet connection during peak hours and off-peak hours. The results are provided in the accompanying table. Peak Off-Peak 5.83 5.14 6.05 6.80 7.14 6.98 3.54 5.77 5.45 7.27 5.90 6.62 5.81 6.19 4.82 6.08 6.37 6.59 4.65 5.58 5.30 7.41 6.48 6.26 5.96 6.37 5.79 6.31 6.84 6.55 5.06 4.95 5.61 7.03 6.45 6.77 Examine the results of Kaitlyn's test to determine the statements that compare the medians and interquartile ranges of the data sets to each other in terms of this situation. Select the two correct answers. The median upload speed during peak hours is 5.905 megabits per second, which is less than the median upload speed during off-peak hours, 7.005 megabits per second. The upload speeds during peak hours are slower on average compared to off-peak times. The median upload speed during peak hours is 6.37 megabits per second, which is greater than the median upload speed during…Provide an overview of how an unknown chemical sample could be analyzed in terms of its atomic structure to identify the element(s) that are present? Also comment briefly on the presence of this element in meteorite craters and the significance of this observation.The Etruscans. Anthropologists are still trying to unravel the mystery of the origins of the Etruscan empire, a highly advanced Italic civilization formed around the eighth century B.C. in central Italy. Were they native to the Italian peninsula or, as many aspects of their civilization suggest, did they migrate from the East by land or sea? The maximum head breadth, in millimeters, of 70 modern Italian male skulls and that of 84 preserved Etruscan male skulls were analyzed to help researchers decide whether the Etruscans were native to Italy. The resulting data can be found on the WeissStats site. [SOURCE: N. Barnicot and D. Brothwell, “The Evaluation of Metrical Data in the Comparison of Ancient and Modern Bones.” In a. use the technology of your choice to obtain boxplots for the data sets, using the same scale. b. compare the data sets by using your results from part (a), paying special attention to center and variation.
- The Etruscans. Anthropologists are still trying to unravel the mystery of the origins of the Etruscan empire, a highly advanced Italic civilization formed around the eighth century B.C. in central Italy. Were they native to the Italian peninsula or, as many aspects of their civilization suggest, did they migrate from the East by land or sea? The maximum head breadth, in millimeters, of 70 modern Italian male skulls and that of 84 preserved Etruscan male skulls were analyzed to help researchers decide whether the Etruscans were native to Italy. The resulting data can be found on the WeissStats site. [SOURCE: N. Barnicot and D. Brothwell, “The Evaluation of Metrical Data in the Comparison of Ancient and Modern Bones.” In Medical Biology and Etruscan Origins, G. Wolstenholme and C. O’Connor, eds., Little, Brown&Co., 1959] a. use the technology of your choice to obtain boxplots for the data sets, using the same scale. b. compare the data sets by using your results from part (a), paying…The Etruscans. Anthropologists are still trying to unravel the mystery of the origins of the Etruscan empire, a highly advanced Italic civilization formed around the eighth century B.C. in central Italy. Were they native to the Italian peninsula or, as many aspects of their civilization suggest, did they migrate from the East by land or sea? The maximum head breadth, in millimeters, of 70 modern Italian male skulls and that of 84 preserved Etruscan male skulls were analyzed to help researchers decide whether the Etruscans were native to Italy. The resulting data can be found on theWeissStats site. [SOURCE: N. Barnicot and D. Brothwell, “The Evaluation of Metrical Data in the Comparison of Ancient and Modern Bones.” In Medical Biology and Etruscan Origins, G. Wolstenholme and C. O’Connor, eds., Little, Brown&Co., 1959] a. use the technology of your choice to determine the mean and median of each of the two data sets. b. compare the two data sets by using your results from part (a).Can you provide any explanation for these results? For THE 3 TABS BELOW: Tab 1, Tab 2 & Tab 3 TAB 1. Year Age of Miss America Murder by steam, hot vapors and hot objects Dev(x) Dev(y) CP 1999 24 7 1.9 2.5 4.69 2000 24 7 1.9 2.5 4.69 2001 24 7 1.9 2.5 4.69 2002 21 3 -1.1 -1.5 1.69 2003 22 4 -0.1 -0.5 0.05 2004 21 3 -1.1 -1.5 1.69 2005 24 8 1.9 3.5 6.60 2006 22 4 -0.1 -0.5 0.05 2007 20 2 -2.1 -2.5 5.32 2008 19 3 -3.1 -1.5 4.78 2009 22 2 -0.1 -2.5 0.23 Mean 22.1 5 Sum 34.45 Standard Deviation 1.75810 2.25227 Covariance 3.45 Correlation Coefficient 0.87013 0.87013 TAB 2 Year Letter in Winning World of Scripps National Spelling Bee Number of people Killed by venomous spider Dev(x) Dev(y) CP 1999 9 6 -1.0 -1.4 1.36 2000 8 5…
- A municipal solid-waste site for a city must be located at Site A or Site B. After sorting, some of the solid refuse will be transported to an electric powerplant where it will be used as fuel. Data for the hauling of refuse from each site to the power plant are shown in Table P2-4. If the power plant will pay $8.00 per cubic yard of sorted solid waste delivered to the plant, where should the solid-waste site be located? Use the city’s viewpoint and assume that 200,000 cubic yards of refuse will be hauled to the plant for one year only. One site must be selected.The Etruscans. Anthropologists are still trying to unravel the mystery of the origins of the Etruscan empire, a highly advanced Italic civilization formed around the eighth century B.C. in central Italy. Were they native to the Italian peninsula or, as many aspects of their civilization suggest, did they migrate from the East by land or sea? The maximum head breadth, in millimeters, of 70 modern Italian male skulls and 84 preserved Etruscan male skulls was analyzed to help researchers decide whether the Etruscans were native to Italy. The resulting data can be found on the WeissStats site. [SOURCE: N. Barnicot and D. Brothwell, “The Evaluation of Metrical Data in the Comparison of Ancient and Modern Bones.” In Medical Biology and Etruscan Origins, G. Wolstenholme and C. O’Connor, eds., Little, Brown&Co., 1959] a. Obtain normal probability plots, boxplots, and the standard deviations for the two samples. b. Based on your results from part (a), which would you be inclined to use to…The vulnerability of inshore environments to contamination due to urban and industrial expansion in Mombasa is discussed in the paper “Metals, Petroleum Hydrocarbons and Organo- chlorines in Inshore Sediments and Waters on Mombasa, Kenya” [Marine Pollution Bulletin (1997) 34:570–577]. A geochemical and oceanographic survey of the inshore waters of Mombasa, Kenya, was undertaken during the period from September 1995 to January 1996. In the survey, suspended particulate matter and sediment were collected from 48 stations within Mombasa’s estuarine creeks. The concentrations of major oxides and 13 trace elements were determined for a varying number of cores at each of the stations. In particular, the lead concentrations in sus-pended particulate matter (mg kg21 dry weight) were determined at 37 stations. The researchers were interested in determining whether the average lead concentration was greater than 30 mg kg21 dry weight. The data are given in the following table along with summary…
- The vulnerability of inshore environments to contamination due to urban and industrial expansion in Mombasa is discussed in the paper “Metals, Petroleum Hydrocarbons and Organo- chlorines in Inshore Sediments and Waters on Mombasa, Kenya” [Marine Pollution Bulletin (1997) 34:570–577]. A geochemical and oceanographic survey of the inshore waters of Mombasa, Kenya, was undertaken during the period from September 1995 to January 1996. In the survey, suspended particulate matter and sediment were collected from 48 stations within Mombasa’s estuarine creeks. The concentrations of major oxides and 13 trace elements were determined for a varying number of cores at each of the stations. In particular, the lead concentrations in sus-pended particulate matter (mg kg21 dry weight) were determined at 37 stations. The researchers were interested in determining whether the average lead concentration was greater than 30 mg kg21 dry weight. The data are given in the following table along with summary…The vulnerability of inshore environments to contamination due to urban and industrial expansion in Mombasa is discussed in the paper €œMetals, Petroleum Hydrocarbons and Organo-chlorines in Inshore Sediments and Waters on Mombasa, Kenya€ [Marine Pollution Bulletin (1997) 34: 570€“ 577]. A geochemical and oceanographic survey of the inshore waters of Mombasa, Kenya, was undertaken during the period from September 1995 to January 1996. In the survey, suspended particulate matter and sediment were collected from 48 stations within Mombasa€™s estuarine creeks. The concentrations of major oxides and 13 trace elements were determined for a varying number of cores at each of the stations. In particular, the lead concentrations in suspended particulate matter (mg kg-1 dry weight) were determined at 37 stations. The researchers were interested in determining whether the average lead concentration was greater than 30 mg kg-1 dry weight. The data are given in the following table along with…Listed below are amounts of strontium-90 (in millibecquerels, or mBq) in a simple random sample of baby teeth obtained from residents in a region born after 1979. Use the given data to construct a boxplot and identify the 5-number summary. a. The 5-number summary is all in mBq. (Use ascending order. Type integers or decimals. Do not round.) b. Which boxplot below represents the data?


