EXT Shape Media Comment The following Table gives the age-specific fertility rates observed in different calendar years in England and Wales. a) Calculate period total fertility rates for each calendar year b) Calculate the cohort total fertility rates for the cohort of women born during the periods: 1943-47 and 1948-52 c) Calculate the proportion of all births which take place to women aged under 35 years for each calendar year. Cal
EXT Shape Media Comment The following Table gives the age-specific fertility rates observed in different calendar years in England and Wales. a) Calculate period total fertility rates for each calendar year b) Calculate the cohort total fertility rates for the cohort of women born during the periods: 1943-47 and 1948-52 c) Calculate the proportion of all births which take place to women aged under 35 years for each calendar year. Cal

MATLAB: An Introduction with Applications
6th Edition
ISBN:9781119256830
Author:Amos Gilat
Publisher:Amos Gilat
Chapter1: Starting With Matlab
Section: Chapter Questions
Problem 1P

Related questions
Question
Demographics methods
Transcribed Image Text:Insert
Table
Chart
Text
Shape
Media
Comment
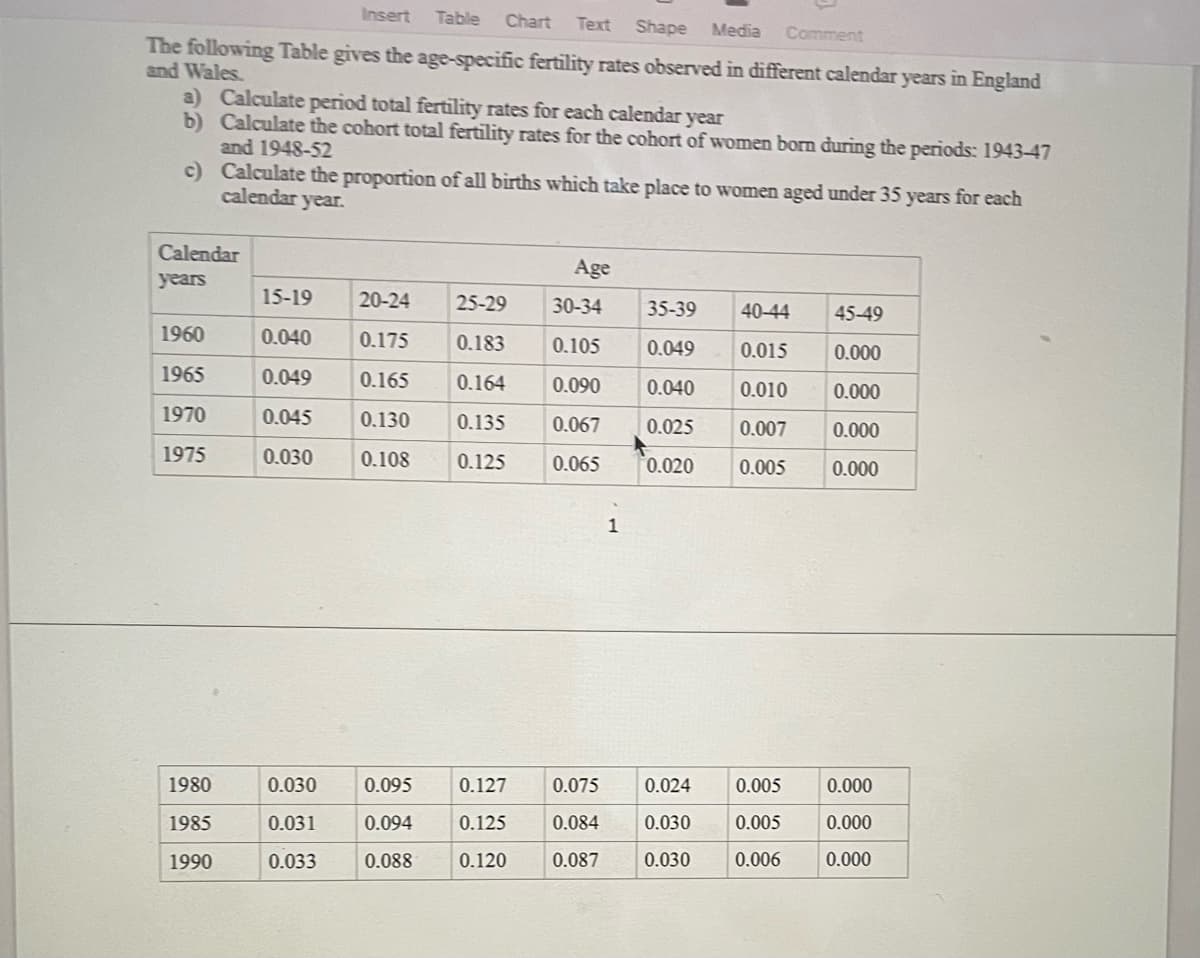
The following Table gives the age-specific fertility rates observed in different calendar years in England
and Wales.
a) Calculate period total fertility rates for each calendar year
b) Calculate the cohort total fertility rates for the cohort of women born during the periods: 1943-47
and 1948-52
c) Calculate the proportion of all births which take place to women aged under 35 years for each
calendar year.
Calendar
Age
years
15-19
20-24
25-29
30-34
35-39
40-44
45-49
1960
0.040
0.175
0.183
0.105
0.049
0.015
0.000
1965
0.049
0.165
0.164
0.090
0.040
0.010
0.000
1970
0.045
0.130
0.135
0.067
0.025
0.007
0.000
1975
0.030
0.108
0.125
0.020
0.005
0.000
1980
0.030
0.095
0.127
0.075
0.024
0.005
0.000
1985
0.031
0.094
0.125
0.084
0.030
0.005
0.000
1990
0.033
0.088
0.120
0.087
0.030
0.006
0.000
Expert Solution
This question has been solved!
Explore an expertly crafted, step-by-step solution for a thorough understanding of key concepts.

Step by step
Solved in 4 steps

Recommended textbooks for you
MATLAB: An Introduction with Applications
Statistics
ISBN:
9781119256830
Author:
Amos Gilat
Publisher:
John Wiley & Sons Inc

Probability and Statistics for Engineering and th…
Statistics
ISBN:
9781305251809
Author:
Jay L. Devore
Publisher:
Cengage Learning

Statistics for The Behavioral Sciences (MindTap C…
Statistics
ISBN:
9781305504912
Author:
Frederick J Gravetter, Larry B. Wallnau
Publisher:
Cengage Learning
MATLAB: An Introduction with Applications
Statistics
ISBN:
9781119256830
Author:
Amos Gilat
Publisher:
John Wiley & Sons Inc
Probability and Statistics for Engineering and th…
Statistics
ISBN:
9781305251809
Author:
Jay L. Devore
Publisher:
Cengage Learning
Statistics for The Behavioral Sciences (MindTap C…
Statistics
ISBN:
9781305504912
Author:
Frederick J Gravetter, Larry B. Wallnau
Publisher:
Cengage Learning

Elementary Statistics: Picturing the World (7th E…
Statistics
ISBN:
9780134683416
Author:
Ron Larson, Betsy Farber
Publisher:
PEARSON

The Basic Practice of Statistics
Statistics
ISBN:
9781319042578
Author:
David S. Moore, William I. Notz, Michael A. Fligner
Publisher:
W. H. Freeman

Introduction to the Practice of Statistics
Statistics
ISBN:
9781319013387
Author:
David S. Moore, George P. McCabe, Bruce A. Craig
Publisher:
W. H. Freeman