9. Frequency distributions may be compiled for variables measured at which level? a. nominal |b. ordinal |c. interval-ratio d. all of the above
9. Frequency distributions may be compiled for variables measured at which level? a. nominal |b. ordinal |c. interval-ratio d. all of the above

Glencoe Algebra 1, Student Edition, 9780079039897, 0079039898, 2018
18th Edition
ISBN:9780079039897
Author:Carter
Publisher:Carter
Chapter10: Statistics
Section10.4: Distributions Of Data
Problem 19PFA

Related questions
Question
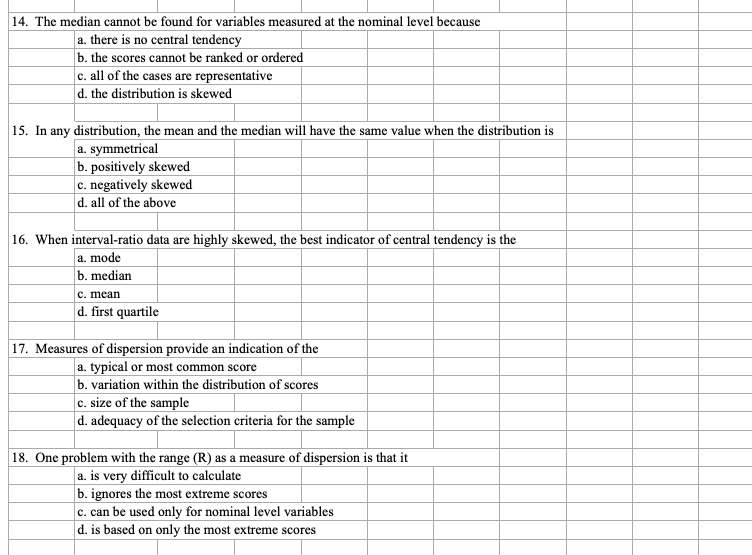
Transcribed Image Text:14. The median cannot be found for variables measured at the nominal level because
a. there is no central tendency
|b. the scores cannot be ranked or ordered
c. all of the cases are representative
|d. the distribution is skewed
15. In any distribution, the mean and the median will have the same value when the distribution is
a. symmetrical
|b. positively skewed
c. negatively skewed
|d. all of the above
16. When interval-ratio data are highly skewed, the best indicator of central tendency is the
a. mode
b. median
c. mean
d. first quartile
17. Measures of dispersion provide an indication of the
a. typical or most common score
b. variation within the distribution of scores
c. size of the sample
d. adequacy of the selection criteria for the sample
18. One problem with the range (R) as a measure of dispersion is that it
| a. is very difficult to calculate
b. ignores the most extreme scores
c. can be used only for nominal level variables
d. is based on only the most extreme scores
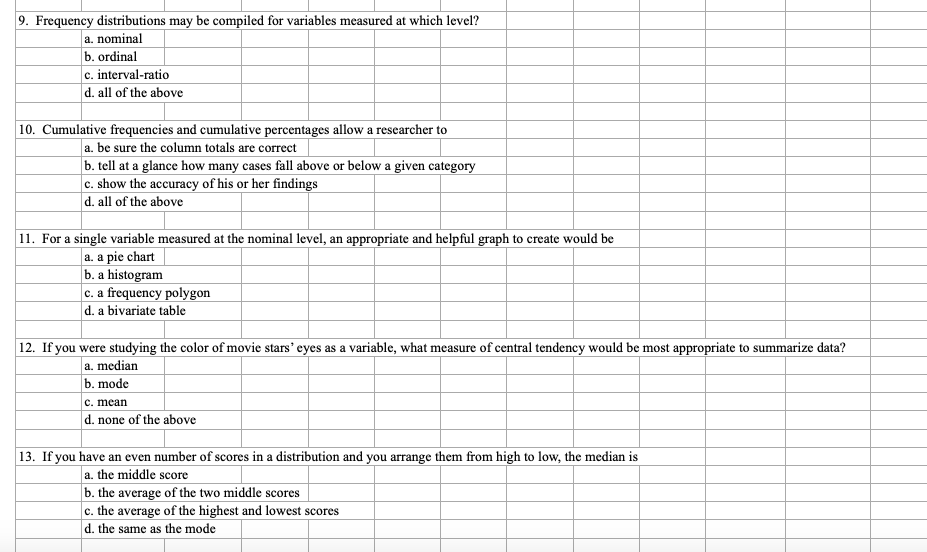
Transcribed Image Text:9. Frequency distributions may be compiled for variables measured at which level?
a. nominal
b. ordinal
c. interval-ratio
|d. all of the above
|10. Cumulative frequencies and cumulative percentages allow a rescarcher to
a. be sure the column totals are correct
b. tell at a glance how many cases fall above or below a given category
|c. show the accuracy of his or her findings
d. all of the above
11. For a single variable measured at the nominal level, an appropriate and helpful graph to create would be
a. a pie chart
b. a histogram
c. a frequency polygon
|d. a bivariate table
12. If you were studying the color of movie stars' eyes as a variable, what measure of central tendency would be most appropriate to summarize data?
a. median
b. mode
c. mean
d. none of the above
|13. If you have an even number of scores in a distribution and you arrange them from high to low, the median is
a. the middle score
|b. the average of the two middle scores
c. the average of the highest and lowest scores
|d. the same as the mode
Expert Solution
This question has been solved!
Explore an expertly crafted, step-by-step solution for a thorough understanding of key concepts.

This is a popular solution!

Trending now
This is a popular solution!

Step by step
Solved in 2 steps

Knowledge Booster


Learn more about
Need a deep-dive on the concept behind this application? Look no further. Learn more about this topic, statistics and related others by exploring similar questions and additional content below.Recommended textbooks for you
Glencoe Algebra 1, Student Edition, 9780079039897…
Algebra
ISBN:
9780079039897
Author:
Carter
Publisher:
McGraw Hill

Mathematics For Machine Technology
Advanced Math
ISBN:
9781337798310
Author:
Peterson, John.
Publisher:
Cengage Learning,

Holt Mcdougal Larson Pre-algebra: Student Edition…
Algebra
ISBN:
9780547587776
Author:
HOLT MCDOUGAL
Publisher:
HOLT MCDOUGAL
Glencoe Algebra 1, Student Edition, 9780079039897…
Algebra
ISBN:
9780079039897
Author:
Carter
Publisher:
McGraw Hill
Mathematics For Machine Technology
Advanced Math
ISBN:
9781337798310
Author:
Peterson, John.
Publisher:
Cengage Learning,
Holt Mcdougal Larson Pre-algebra: Student Edition…
Algebra
ISBN:
9780547587776
Author:
HOLT MCDOUGAL
Publisher:
HOLT MCDOUGAL