A cohort study is conducted to assess the association between clinical characteristic and the risk of stroke. The study involves n-1,250 participants who are free of stroke at the study start. Each participant is assessed at study start (baseline) and every year thereafter for five years. The following table displays data on hypertension status measured at baseline and hypertension status measured two years later. 1. s 2 Years: Not Hvpertensive 850 45 2 Years: Hypertensive 148 207 Baseline: Not Hvpertensive Baseline: Hypertensive Compute the prevalence of hypertension at baseline Prevalence - Compute the prevalence of hvpertension at 2 vears. Prevalence - Compute the cumulative incidence of hypertension over 2 years. Incidence
A cohort study is conducted to assess the association between clinical characteristic and the risk of stroke. The study involves n-1,250 participants who are free of stroke at the study start. Each participant is assessed at study start (baseline) and every year thereafter for five years. The following table displays data on hypertension status measured at baseline and hypertension status measured two years later. 1. s 2 Years: Not Hvpertensive 850 45 2 Years: Hypertensive 148 207 Baseline: Not Hvpertensive Baseline: Hypertensive Compute the prevalence of hypertension at baseline Prevalence - Compute the prevalence of hvpertension at 2 vears. Prevalence - Compute the cumulative incidence of hypertension over 2 years. Incidence

Linear Algebra: A Modern Introduction
4th Edition
ISBN:9781285463247
Author:David Poole
Publisher:David Poole
Chapter4: Eigenvalues And Eigenvectors
Section4.6: Applications And The Perron-frobenius Theorem
Problem 25EQ

Related questions
Question
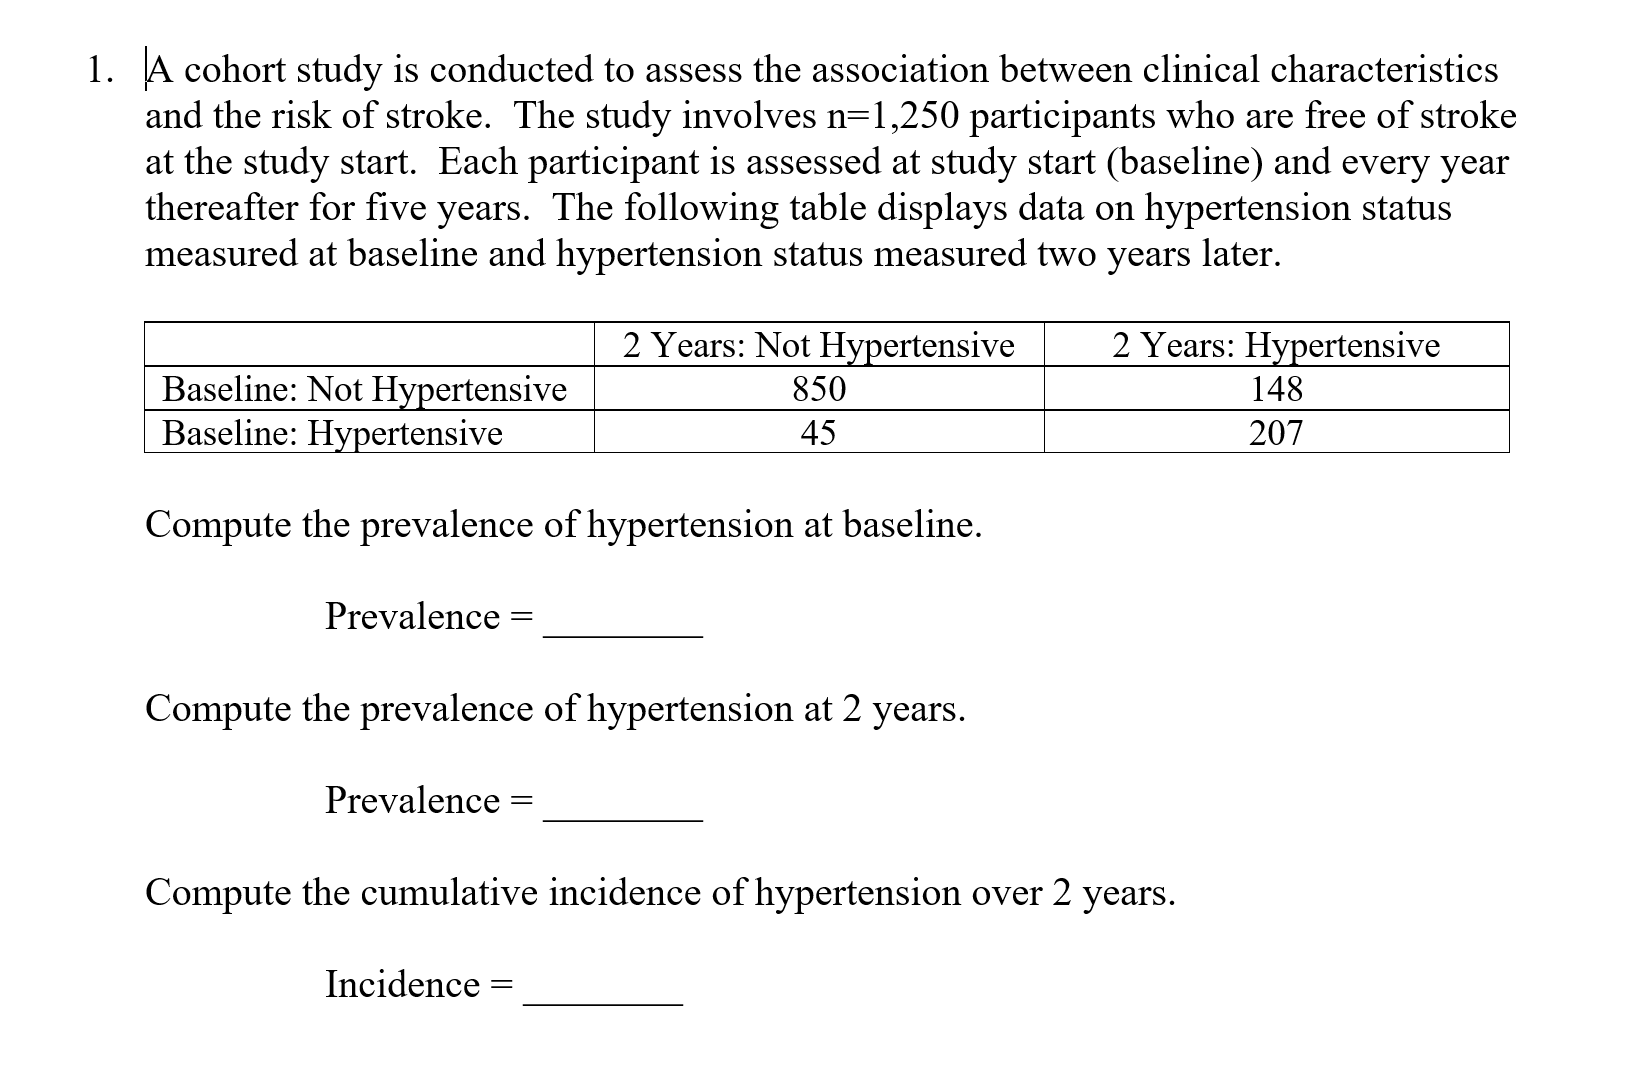
Transcribed Image Text:A cohort study is conducted to assess the association between clinical characteristic
and the risk of stroke. The study involves n-1,250 participants who are free of stroke
at the study start. Each participant is assessed at study start (baseline) and every year
thereafter for five years. The following table displays data on hypertension status
measured at baseline and hypertension status measured two years later.
1.
s
2 Years: Not Hvpertensive
850
45
2 Years: Hypertensive
148
207
Baseline: Not Hvpertensive
Baseline: Hypertensive
Compute the prevalence of hypertension at baseline
Prevalence -
Compute the prevalence of hvpertension at 2 vears.
Prevalence -
Compute the cumulative incidence of hypertension over 2 years.
Incidence
Expert Solution
This question has been solved!
Explore an expertly crafted, step-by-step solution for a thorough understanding of key concepts.

This is a popular solution!

Trending now
This is a popular solution!

Step by step
Solved in 3 steps

Recommended textbooks for you
Linear Algebra: A Modern Introduction
Algebra
ISBN:
9781285463247
Author:
David Poole
Publisher:
Cengage Learning

Holt Mcdougal Larson Pre-algebra: Student Edition…
Algebra
ISBN:
9780547587776
Author:
HOLT MCDOUGAL
Publisher:
HOLT MCDOUGAL

Glencoe Algebra 1, Student Edition, 9780079039897…
Algebra
ISBN:
9780079039897
Author:
Carter
Publisher:
McGraw Hill
Linear Algebra: A Modern Introduction
Algebra
ISBN:
9781285463247
Author:
David Poole
Publisher:
Cengage Learning
Holt Mcdougal Larson Pre-algebra: Student Edition…
Algebra
ISBN:
9780547587776
Author:
HOLT MCDOUGAL
Publisher:
HOLT MCDOUGAL
Glencoe Algebra 1, Student Edition, 9780079039897…
Algebra
ISBN:
9780079039897
Author:
Carter
Publisher:
McGraw Hill