A governmental agency computed the proportion of violent crimes in the United States in a particular year falling into each of four categories. A simple random sample of 550 violent crimes committed in California during that year were categorized in the same way. The following table presents the results. U.S. California Category Proportion Frequency Murder 0.012 Forcible Rape 0.058 20 Robbery 0.360 207 Aggravated Assault 0.570 318 Send data to Excel Can you conclude that the proportions of crimes in the various categories in California differ from those in the United States as a whole? Use the 0.01 level of significance and the P-value method with the TI-84 Plus calculator.
A governmental agency computed the proportion of violent crimes in the United States in a particular year falling into each of four categories. A simple random sample of 550 violent crimes committed in California during that year were categorized in the same way. The following table presents the results. U.S. California Category Proportion Frequency Murder 0.012 Forcible Rape 0.058 20 Robbery 0.360 207 Aggravated Assault 0.570 318 Send data to Excel Can you conclude that the proportions of crimes in the various categories in California differ from those in the United States as a whole? Use the 0.01 level of significance and the P-value method with the TI-84 Plus calculator.

College Algebra (MindTap Course List)
12th Edition
ISBN:9781305652231
Author:R. David Gustafson, Jeff Hughes
Publisher:R. David Gustafson, Jeff Hughes
Chapter8: Sequences, Series, And Probability
Section8.7: Probability
Problem 5E: List the sample space of each experiment. Rolling one die and tossing one coin

Related questions
Topic Video
Question
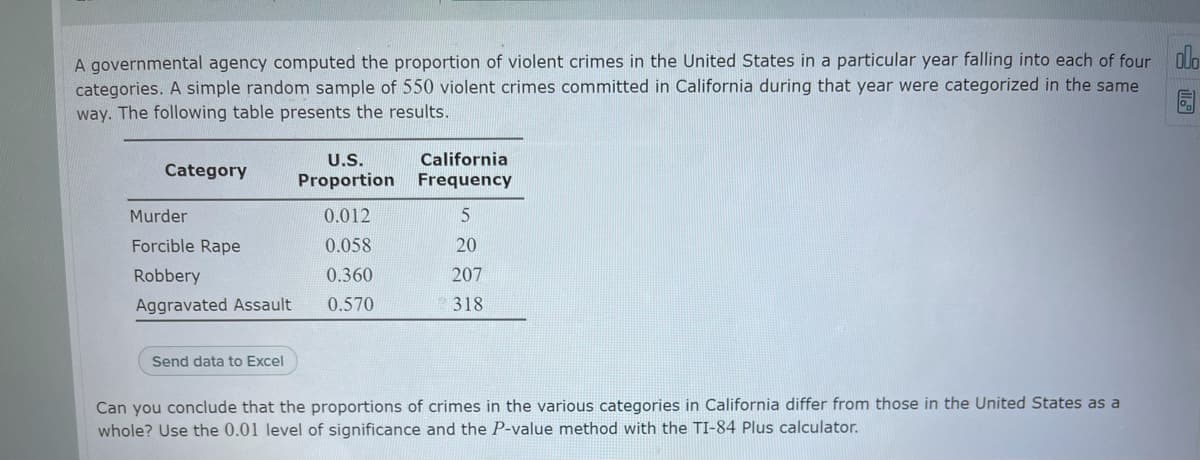
Transcribed Image Text:A governmental agency computed the proportion of violent crimes in the United States in a particular year falling into each of four oln
categories. A simple random sample of 550 violent crimes committed in California during that year were categorized in the same
way. The following table presents the results.
U.S.
California
Category
Proportion
Frequency
Murder
0.012
Forcible Rape
0.058
20
Robbery
0.360
207
Aggravated Assault
0.570
318
Send data to Excel
Can you conclude that the proportions of crimes in the various categories in California differ from those in the United States as a
whole? Use the 0.01 level of significance and the P-value method with the TI-84 Plus calculator.

Transcribed Image Text:(b) Find the P-value. Round the answer to at least four decimal places.
The P-value is
Expert Solution
This question has been solved!
Explore an expertly crafted, step-by-step solution for a thorough understanding of key concepts.

This is a popular solution!

Trending now
This is a popular solution!

Step by step
Solved in 5 steps

Knowledge Booster


Learn more about
Need a deep-dive on the concept behind this application? Look no further. Learn more about this topic, statistics and related others by exploring similar questions and additional content below.Recommended textbooks for you
College Algebra (MindTap Course List)
Algebra
ISBN:
9781305652231
Author:
R. David Gustafson, Jeff Hughes
Publisher:
Cengage Learning

Holt Mcdougal Larson Pre-algebra: Student Edition…
Algebra
ISBN:
9780547587776
Author:
HOLT MCDOUGAL
Publisher:
HOLT MCDOUGAL

College Algebra (MindTap Course List)
Algebra
ISBN:
9781305652231
Author:
R. David Gustafson, Jeff Hughes
Publisher:
Cengage Learning
Holt Mcdougal Larson Pre-algebra: Student Edition…
Algebra
ISBN:
9780547587776
Author:
HOLT MCDOUGAL
Publisher:
HOLT MCDOUGAL