A highway department is studying the relationship between traffic flow and speed. The following model has been hypothesized. ŷ = bo + bịz +bzz? where y = traffic flow in vehicles per hour T= vehicle speed in miles per hour The following data were collected during rush hour for six highways leading out of the city. Traffic Flow (y) Vehicle Speed (2) 1256 36 1329 45 1226 30 1335 45 1349 55 1125 25 a. Use the data to compute the coefficients of this estimated regression equation (to 4 decimals). Enter negative value as negative number. (Create the z variable first using Data/Transform Data/Square.) bo = by = by = b. Using a = 0.01, test for a significant relationship. F = (to 4 decimals) p-value = (to 4 decimals) The relationship - Select your answer - significant. c. Estimate the traffic flow in vehicles per hour at a speed of 38 miles per hour (to 2 decimals). vehicles per hour
A highway department is studying the relationship between traffic flow and speed. The following model has been hypothesized. ŷ = bo + bịz +bzz? where y = traffic flow in vehicles per hour T= vehicle speed in miles per hour The following data were collected during rush hour for six highways leading out of the city. Traffic Flow (y) Vehicle Speed (2) 1256 36 1329 45 1226 30 1335 45 1349 55 1125 25 a. Use the data to compute the coefficients of this estimated regression equation (to 4 decimals). Enter negative value as negative number. (Create the z variable first using Data/Transform Data/Square.) bo = by = by = b. Using a = 0.01, test for a significant relationship. F = (to 4 decimals) p-value = (to 4 decimals) The relationship - Select your answer - significant. c. Estimate the traffic flow in vehicles per hour at a speed of 38 miles per hour (to 2 decimals). vehicles per hour

Linear Algebra: A Modern Introduction
4th Edition
ISBN:9781285463247
Author:David Poole
Publisher:David Poole
Chapter7: Distance And Approximation
Section7.3: Least Squares Approximation
Problem 32EQ

Related questions

Concept explainers
Contingency Table
A contingency table can be defined as the visual representation of the relationship between two or more categorical variables that can be evaluated and registered. It is a categorical version of the scatterplot, which is used to investigate the linear relationship between two variables. A contingency table is indeed a type of frequency distribution table that displays two variables at the same time.
Binomial Distribution
Binomial is an algebraic expression of the sum or the difference of two terms. Before knowing about binomial distribution, we must know about the binomial theorem.
Topic Video
Question
100%
2
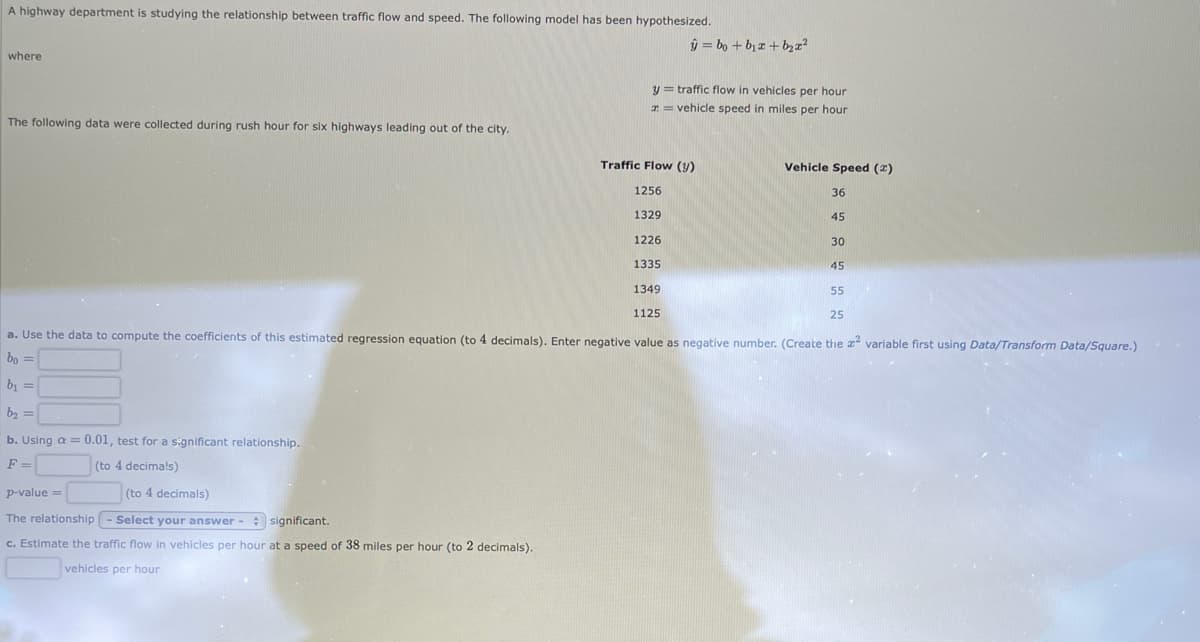
Transcribed Image Text:A highway department is studying the relationship between traffic flow and speed. The following model has been hypothesized.
ŷ = bo + bịz + bzz?
where
y = traffic flow in vehicles per hour
T = vehicle speed in miles per hour
The following data were collected during rush hour for six highways leading out of the city.
Traffic Flow (Y)
Vehicle Speed (2)
1256
36
1329
45
1226
30
1335
45
1349
55
1125
25
a. Use the data to compute the coefficients of this estimated regression equation (to 4 decimals). Enter negative value as negative number. (Create the z variable first using Data/Transform Data/Square.)
bo =
bị =
b2 =
b. Using a = 0.01, test for a significant relationship.
F =
(to 4 decimals)
p-value =
(to 4 decimals)
The relationship
Select your answer - significant.
c. Estimate the traffic flow in vehicles per hour at a speed of 38 miles per hour (to 2 decimals).
vehicles per hour
Expert Solution
This question has been solved!
Explore an expertly crafted, step-by-step solution for a thorough understanding of key concepts.

This is a popular solution!

Trending now
This is a popular solution!

Step by step
Solved in 3 steps with 2 images

Knowledge Booster


Learn more about
Need a deep-dive on the concept behind this application? Look no further. Learn more about this topic, statistics and related others by exploring similar questions and additional content below.Recommended textbooks for you
Linear Algebra: A Modern Introduction
Algebra
ISBN:
9781285463247
Author:
David Poole
Publisher:
Cengage Learning

Algebra & Trigonometry with Analytic Geometry
Algebra
ISBN:
9781133382119
Author:
Swokowski
Publisher:
Cengage

Functions and Change: A Modeling Approach to Coll…
Algebra
ISBN:
9781337111348
Author:
Bruce Crauder, Benny Evans, Alan Noell
Publisher:
Cengage Learning
Linear Algebra: A Modern Introduction
Algebra
ISBN:
9781285463247
Author:
David Poole
Publisher:
Cengage Learning
Algebra & Trigonometry with Analytic Geometry
Algebra
ISBN:
9781133382119
Author:
Swokowski
Publisher:
Cengage
Functions and Change: A Modeling Approach to Coll…
Algebra
ISBN:
9781337111348
Author:
Bruce Crauder, Benny Evans, Alan Noell
Publisher:
Cengage Learning