À local University conducted a survey of over 2,000 MBA alumni to explore the issue of work-life balance. Each participant received a score ranging from 0 to 100, with lower scores indicating a higher imbalance between work and of the data is available below. Let x=average number of hours worked per week and y = work-life balance scale score for each MBA alumnus. Investigate the link between these two variables by conducting a complete simple linea analysis of the data. Summarize your findings. E Click the icon to view the data. The least squares regression equation is y =+ ( x. (Round to two decimal places as needed.) Check the usefulness of the hypothesized model. What are the hypotheses to test? Revenue and message rate for recekt movies O A. Ho: Po0 against H Po = 0 O B. Ho: B, *0 against H, B, = 0 Hours WLB Score 50 77.01 OC. Ho: Bo =0 against H: Bo #0 45 50 72.02 49.07 O D. H: B, = 0 against H: B, *0 60 50 44.14 69.95 54.39 Determine the estimate of the standard deviation. 60 55 60 57.36 22.64 s= (Round to two decimal places as needed.) 50 50 70 61.03 69.95 26.79 72.02 What is the test statistic for the hypotheses? t= (Round to two decimal places as needed.) 45 40 40 33.94 32.12 47.05 What is the p-value for the test statistic? 55 p-value = (Round to three decimal places as needed.) What is the value for the coefficient of determination ?? - (Round to two decimal places as needed.) Print Done State the conclusion at a = 0.05
À local University conducted a survey of over 2,000 MBA alumni to explore the issue of work-life balance. Each participant received a score ranging from 0 to 100, with lower scores indicating a higher imbalance between work and of the data is available below. Let x=average number of hours worked per week and y = work-life balance scale score for each MBA alumnus. Investigate the link between these two variables by conducting a complete simple linea analysis of the data. Summarize your findings. E Click the icon to view the data. The least squares regression equation is y =+ ( x. (Round to two decimal places as needed.) Check the usefulness of the hypothesized model. What are the hypotheses to test? Revenue and message rate for recekt movies O A. Ho: Po0 against H Po = 0 O B. Ho: B, *0 against H, B, = 0 Hours WLB Score 50 77.01 OC. Ho: Bo =0 against H: Bo #0 45 50 72.02 49.07 O D. H: B, = 0 against H: B, *0 60 50 44.14 69.95 54.39 Determine the estimate of the standard deviation. 60 55 60 57.36 22.64 s= (Round to two decimal places as needed.) 50 50 70 61.03 69.95 26.79 72.02 What is the test statistic for the hypotheses? t= (Round to two decimal places as needed.) 45 40 40 33.94 32.12 47.05 What is the p-value for the test statistic? 55 p-value = (Round to three decimal places as needed.) What is the value for the coefficient of determination ?? - (Round to two decimal places as needed.) Print Done State the conclusion at a = 0.05

MATLAB: An Introduction with Applications
6th Edition
ISBN:9781119256830
Author:Amos Gilat
Publisher:Amos Gilat
Chapter1: Starting With Matlab
Section: Chapter Questions
Problem 1P

Related questions
Question
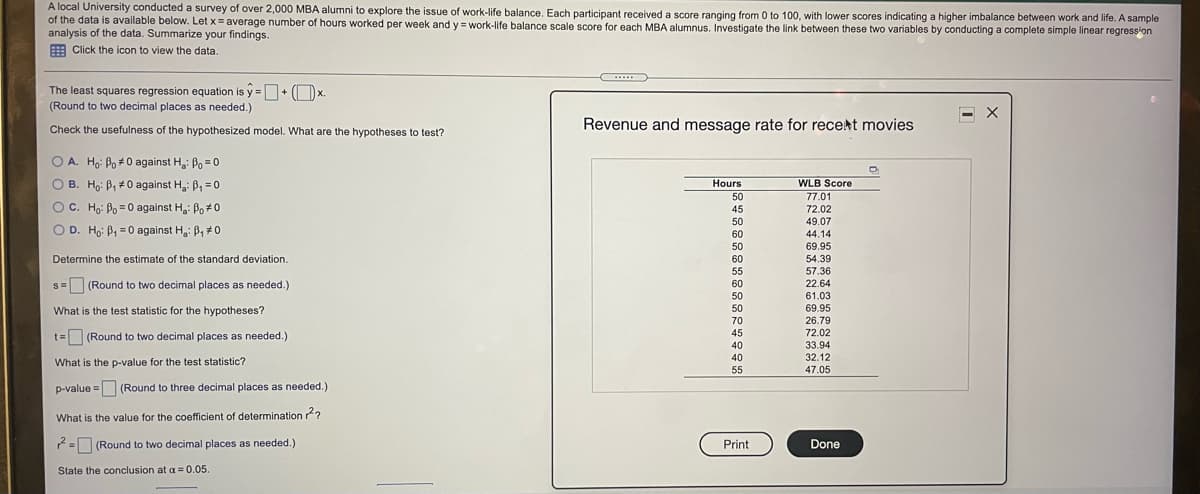
Transcribed Image Text:A local University conducted a survey of over 2,000 MBA alumni to explore the issue of work-life balance. Each participant received a score ranging from 0 to 100, with lower scores indicating a higher imbalance between work and life. A sample
of the data is available below. Let x= average number of hours worked per week and y = work-life balance scale score for each MBA alumnus. Investigate the link between these two variables by conducting a complete simple linear regression
analysis of the data. Summarize your findings.
E Click the icon to view the data.
The least squares regression equation is y =+ (Ox
X.
(Round to two decimal places as needed.)
Revenue and message rate for recekt movies
Check the usefulness of the hypothesized model. What are the hypotheses to test?
O A. Ho: Po * 0 against H: Po = 0
O B. Ho: B, #0 against H: B, = 0
Hours
WLB Score
50
45
77.01
OC. Ho: Po = 0 against H: Po #0
72.02
49.07
50
O D. Ho: B, = 0 against H: B, #0
60
50
44.14
69.95
Determine the estimate of the standard deviation.
60
55
60
54.39
57.36
22.64
s= (Round to two decimal places as needed.)
50
50
61.03
69.95
26.79
What is the test statistic for the hypotheses?
70
45
40
40
72.02
t= (Round to two decimal places as needed.)
33.94
32.12
47.05
What is the p-value for the test statistic?
55
p-value = (Round to three decimal places as needed.)
What is the value for the coefficient of determination r?
= (Round to two decimal places as needed.)
Print
Done
State the conclusion at a= 0.05.
Expert Solution
This question has been solved!
Explore an expertly crafted, step-by-step solution for a thorough understanding of key concepts.

This is a popular solution!

Trending now
This is a popular solution!

Step by step
Solved in 6 steps with 4 images

Recommended textbooks for you
MATLAB: An Introduction with Applications
Statistics
ISBN:
9781119256830
Author:
Amos Gilat
Publisher:
John Wiley & Sons Inc

Probability and Statistics for Engineering and th…
Statistics
ISBN:
9781305251809
Author:
Jay L. Devore
Publisher:
Cengage Learning

Statistics for The Behavioral Sciences (MindTap C…
Statistics
ISBN:
9781305504912
Author:
Frederick J Gravetter, Larry B. Wallnau
Publisher:
Cengage Learning
MATLAB: An Introduction with Applications
Statistics
ISBN:
9781119256830
Author:
Amos Gilat
Publisher:
John Wiley & Sons Inc
Probability and Statistics for Engineering and th…
Statistics
ISBN:
9781305251809
Author:
Jay L. Devore
Publisher:
Cengage Learning
Statistics for The Behavioral Sciences (MindTap C…
Statistics
ISBN:
9781305504912
Author:
Frederick J Gravetter, Larry B. Wallnau
Publisher:
Cengage Learning

Elementary Statistics: Picturing the World (7th E…
Statistics
ISBN:
9780134683416
Author:
Ron Larson, Betsy Farber
Publisher:
PEARSON

The Basic Practice of Statistics
Statistics
ISBN:
9781319042578
Author:
David S. Moore, William I. Notz, Michael A. Fligner
Publisher:
W. H. Freeman

Introduction to the Practice of Statistics
Statistics
ISBN:
9781319013387
Author:
David S. Moore, George P. McCabe, Bruce A. Craig
Publisher:
W. H. Freeman