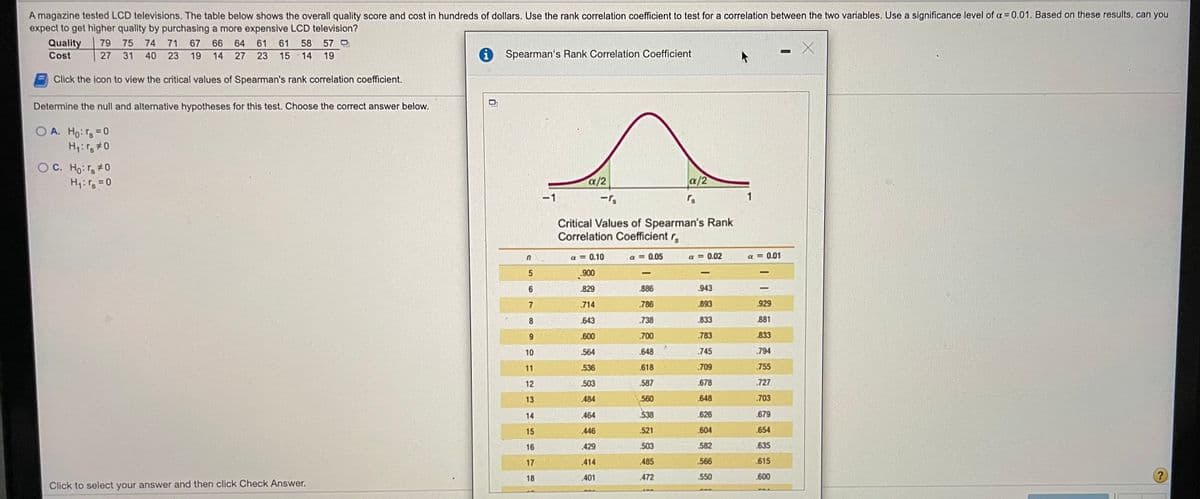
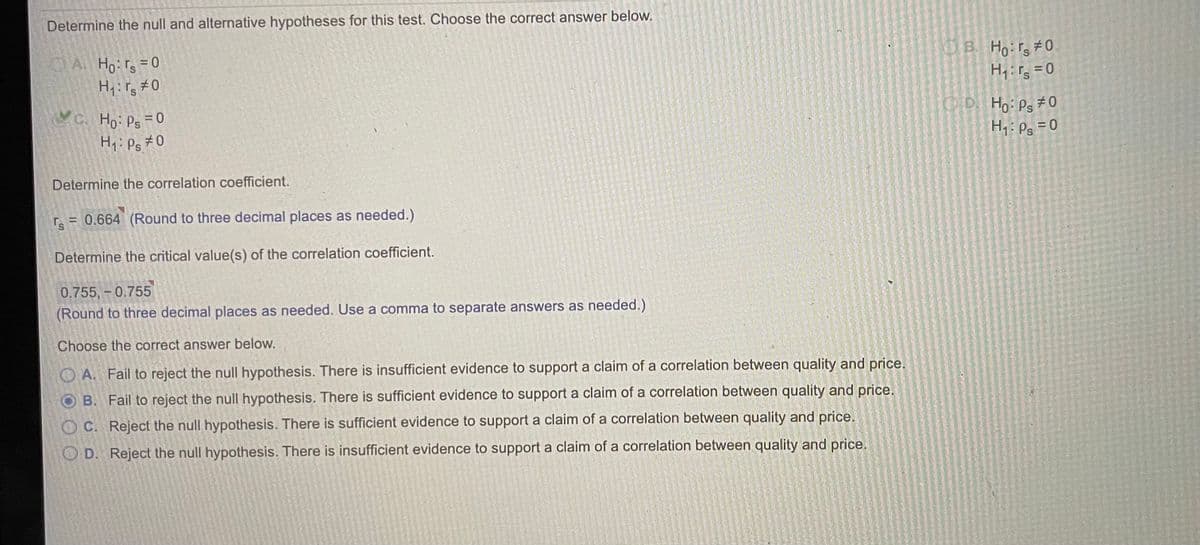
A magazine tested LCD televisions. The table below shows the overall quality score and cost in hundreds of dollars. Use the rank correlation coefficient to test for a correlation between the two variables. Use a significance level of a = 0.01. Based on these results, can you expect to get higher quality by purchasing a more expensive LCD television? Quality 79 75 74 71 67 66 64 61 61 58 57 o Cost | 27 31 40 23 19 14 27 23 15 14 19 Spearman's Rank Correlation Coefficient Click the icon to view the critical values of Spearman's rank correlation coefficient. Determine the null and alternative hypotheses for this test. Choose the correct answer below. OA. Ho:-0 OC. Ho:r, 40 H:r,0 a/2 a/2 -1 -r. 1 Critical Values of Spearman's Rank Correlation Coefficient r, a- 0.05 a- 0.02 a- 0.01 a- 0.10 900 829 943 714 786 893 929 8 543 738 833 881 800 700 783 833 10 564 648 745 794 11 536 618 709 755 12 503 587 678 727


Correlation
Correlation defines a relationship between two independent variables. It tells the degree to which variables move in relation to each other. When two sets of data are related to each other, there is a correlation between them.
Linear Correlation
A correlation is used to determine the relationships between numerical and categorical variables. In other words, it is an indicator of how things are connected to one another. The correlation analysis is the study of how variables are related.
Regression Analysis
Regression analysis is a statistical method in which it estimates the relationship between a dependent variable and one or more independent variable. In simple terms dependent variable is called as outcome variable and independent variable is called as predictors. Regression analysis is one of the methods to find the trends in data. The independent variable used in Regression analysis is named Predictor variable. It offers data of an associated dependent variable regarding a particular outcome.


Trending now
This is a popular solution!

Step by step
Solved in 2 steps


