The Monthly demand for unit manufactured by the ABC Company has been as follows: Units 250 290 240 280 300 270 290 Month January February March April May June July a.use a four-week weighted moving average to forecast the units of month august by using weights of 40%, 30%, 20% & 10% respectively. b. use exponential smoothing with α=0.3 to forecast the units of month august. c. calculate the mad & mse (use exponential smoothing method).
The Monthly demand for unit manufactured by the ABC Company has been as follows: Units 250 290 240 280 300 270 290 Month January February March April May June July a.use a four-week weighted moving average to forecast the units of month august by using weights of 40%, 30%, 20% & 10% respectively. b. use exponential smoothing with α=0.3 to forecast the units of month august. c. calculate the mad & mse (use exponential smoothing method).

Functions and Change: A Modeling Approach to College Algebra (MindTap Course List)
6th Edition
ISBN:9781337111348
Author:Bruce Crauder, Benny Evans, Alan Noell
Publisher:Bruce Crauder, Benny Evans, Alan Noell
Chapter5: A Survey Of Other Common Functions
Section5.6: Higher-degree Polynomials And Rational Functions
Problem 1TU: The following fictitious table shows kryptonite price, in dollar per gram, t years after 2006. t=...

Related questions
Question
The Monthly demand for unit manufactured by the ABC Company has been as follows:
| Units | 250 | 290 | 240 | 280 | 300 | 270 | 290 | |
| Month | January | February | March | April | May | June | July |
a.use a four-week weighted moving average to forecast the units of month august by using weights of 40%, 30%, 20% & 10% respectively.
b. use exponential smoothing with α=0.3 to forecast the units of month august.
c. calculate the mad & mse (use exponential smoothing method).
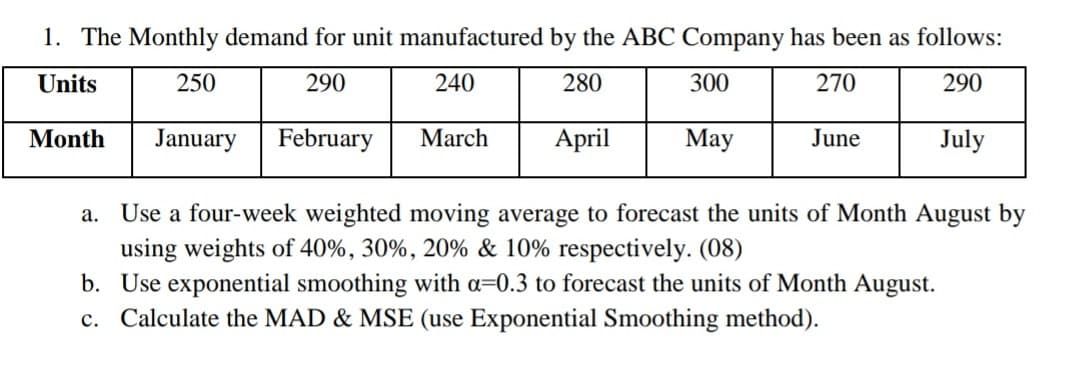
Transcribed Image Text:1. The Monthly demand for unit manufactured by the ABC Company has been as follows:
Units
250
290
240
280
300
270
290
Month
January
February
March
April
May
June
July
a. Use a four-week weighted moving average to forecast the units of Month August by
using weights of 40%, 30%, 20% & 10% respectively. (08)
b. Use exponential smoothing with a=0.3 to forecast the units of Month August.
c. Calculate the MAD & MSE (use Exponential Smoothing method).
Expert Solution
This question has been solved!
Explore an expertly crafted, step-by-step solution for a thorough understanding of key concepts.

This is a popular solution!

Trending now
This is a popular solution!

Step by step
Solved in 4 steps

Knowledge Booster


Learn more about
Need a deep-dive on the concept behind this application? Look no further. Learn more about this topic, statistics and related others by exploring similar questions and additional content below.Recommended textbooks for you
Functions and Change: A Modeling Approach to Coll…
Algebra
ISBN:
9781337111348
Author:
Bruce Crauder, Benny Evans, Alan Noell
Publisher:
Cengage Learning

Linear Algebra: A Modern Introduction
Algebra
ISBN:
9781285463247
Author:
David Poole
Publisher:
Cengage Learning
Functions and Change: A Modeling Approach to Coll…
Algebra
ISBN:
9781337111348
Author:
Bruce Crauder, Benny Evans, Alan Noell
Publisher:
Cengage Learning
Linear Algebra: A Modern Introduction
Algebra
ISBN:
9781285463247
Author:
David Poole
Publisher:
Cengage Learning