A popular theory is that presidential candidates have an advantage if they are taller than their main opponents. Listed are heights (in centimeters) of randomly selected presidents along with the heights of their main opponents. Complete parts (a) and (b) below. Height (cm) of President Height (cm) of Main Opponent 163 189 174 172 184 169 178 176 173 188 199 164 O a. Use the sample data with a 0.05 significance level to test the claim that for the population of heights for presidents and their main opponents, the differences have a mean greater than 0 cm. In this example, Ha is the mean value of the differences d for the population of all pairs of data, where each individual difference d is defined as the president's height minus their main opponent's height. What are the null and alternative hypotheses for the hypothesis test? Ho: Hd cm H1: Ha V cm (Type integers or decimals. Do not round.) Identify the test statistic. t= (Round to two decimal places as needed.) Identify the P-value. P-value = (Round to three decimal places as needed.) What is the conclusion based on the hypothesis test? Since the P-value is V the significance level, V the null hypothesis. There V sufficient evidence to support the claim that presidents tend to be taller than their opponents. b. Construct the confidence interval that could be used for the hypothesis test described in part (a). What feature of the confidence interval leads to the same conclusion reached in part (a)? The confidence interval is cm < Ha < cm. (Round to one decimal place as needed.) What feature of the confidence interval leads to the same conclusion reached in part (a)? Since the confidence interval contains V the null hypothesis.
A popular theory is that presidential candidates have an advantage if they are taller than their main opponents. Listed are heights (in centimeters) of randomly selected presidents along with the heights of their main opponents. Complete parts (a) and (b) below. Height (cm) of President Height (cm) of Main Opponent 163 189 174 172 184 169 178 176 173 188 199 164 O a. Use the sample data with a 0.05 significance level to test the claim that for the population of heights for presidents and their main opponents, the differences have a mean greater than 0 cm. In this example, Ha is the mean value of the differences d for the population of all pairs of data, where each individual difference d is defined as the president's height minus their main opponent's height. What are the null and alternative hypotheses for the hypothesis test? Ho: Hd cm H1: Ha V cm (Type integers or decimals. Do not round.) Identify the test statistic. t= (Round to two decimal places as needed.) Identify the P-value. P-value = (Round to three decimal places as needed.) What is the conclusion based on the hypothesis test? Since the P-value is V the significance level, V the null hypothesis. There V sufficient evidence to support the claim that presidents tend to be taller than their opponents. b. Construct the confidence interval that could be used for the hypothesis test described in part (a). What feature of the confidence interval leads to the same conclusion reached in part (a)? The confidence interval is cm < Ha < cm. (Round to one decimal place as needed.) What feature of the confidence interval leads to the same conclusion reached in part (a)? Since the confidence interval contains V the null hypothesis.

Glencoe Algebra 1, Student Edition, 9780079039897, 0079039898, 2018
18th Edition
ISBN:9780079039897
Author:Carter
Publisher:Carter
Chapter4: Equations Of Linear Functions
Section: Chapter Questions
Problem 8SGR

Related questions
Question
I am having trouble with this one, please help. Thank you
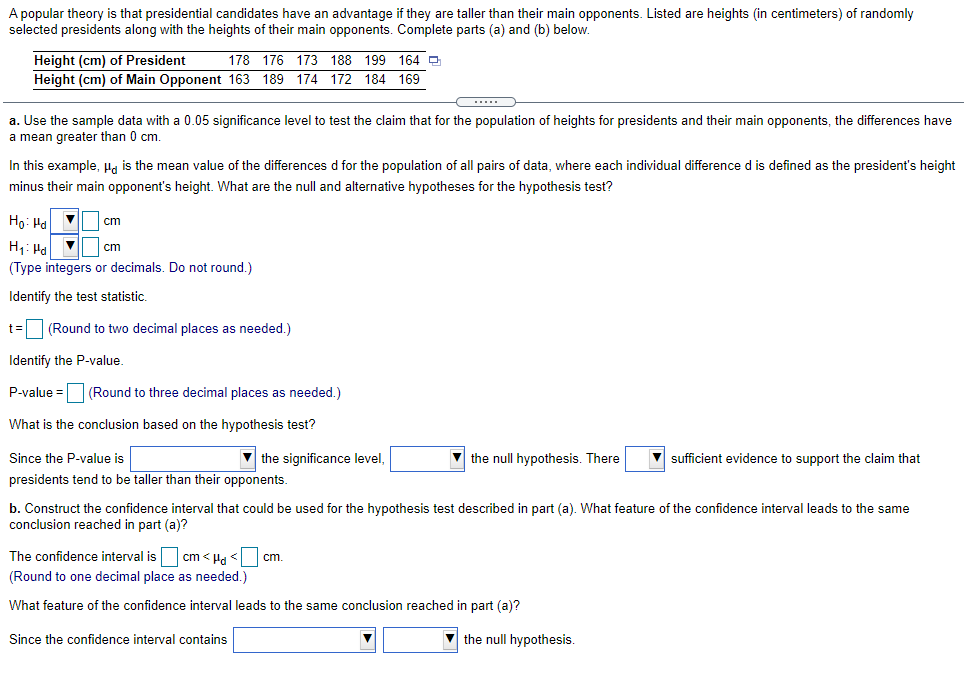
Transcribed Image Text:A popular theory is that presidential candidates have an advantage if they are taller than their main opponents. Listed are heights (in centimeters) of randomly
selected presidents along with the heights of their main opponents. Complete parts (a) and (b) below.
Height (cm) of President
Height (cm) of Main Opponent 163 189 174 172 184 169
178 176 173 188 199 164 O
a. Use the sample data with a 0.05 significance level to test the claim that for the population of heights for presidents and their main opponents, the differences have
a mean greater than 0 cm.
In this example, Ha is the mean value of the differences d for the population of all pairs of data, where each individual difference d is defined as the president's height
minus their main opponent's height. What are the null and alternative hypotheses for the hypothesis test?
Ho: Hd
cm
H1: Ha V cm
(Type integers or decimals. Do not round.)
Identify the test statistic.
t= (Round to two decimal places as needed.)
Identify the P-value.
P-value = (Round to three decimal places as needed.)
What is the conclusion based on the hypothesis test?
Since the P-value is
V the significance level,
V the null hypothesis. There
V sufficient evidence to support the claim that
presidents tend to be taller than their opponents.
b. Construct the confidence interval that could be used for the hypothesis test described in part (a). What feature of the confidence interval leads to the same
conclusion reached in part (a)?
The confidence interval is
cm < Ha <
cm.
(Round to one decimal place as needed.)
What feature of the confidence interval leads to the same conclusion reached in part (a)?
Since the confidence interval contains
V the null hypothesis.
Expert Solution
This question has been solved!
Explore an expertly crafted, step-by-step solution for a thorough understanding of key concepts.

This is a popular solution!

Trending now
This is a popular solution!

Step by step
Solved in 2 steps with 1 images

Recommended textbooks for you
Glencoe Algebra 1, Student Edition, 9780079039897…
Algebra
ISBN:
9780079039897
Author:
Carter
Publisher:
McGraw Hill

College Algebra (MindTap Course List)
Algebra
ISBN:
9781305652231
Author:
R. David Gustafson, Jeff Hughes
Publisher:
Cengage Learning

Glencoe Algebra 1, Student Edition, 9780079039897…
Algebra
ISBN:
9780079039897
Author:
Carter
Publisher:
McGraw Hill
College Algebra (MindTap Course List)
Algebra
ISBN:
9781305652231
Author:
R. David Gustafson, Jeff Hughes
Publisher:
Cengage Learning