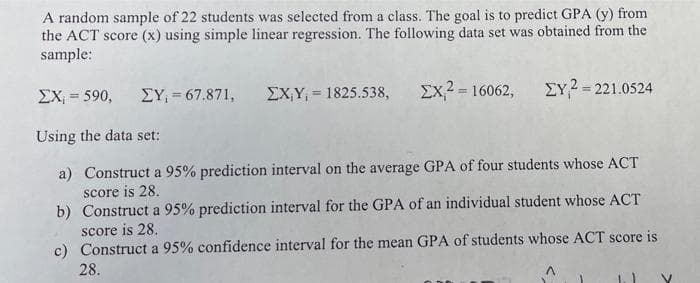
A random sample of 22 students was selected from a class. The goal is to predict GPA (y) from the ACT score (x) using simple linear regression. The following data set was obtained from the sample: EY = 67.871, EX,Y, = 1825.538, Ex? = 16062, EY?= 221.0524 ΣΧ-590, %3D Using the data set: a) Construct a 95% prediction interval on the average GPA of four students whose ACT score is 28. b) Construct a 95% prediction interval for the GPA of an individual student whose ACT score is 28. c) Construct a 95% confidence interval for the mean GPA of students whose ACT score is 28.
Q: An article in the Journal of Sound and Vibration (Vol. 151, 1991, pp. 383-394) described a study…
A:
Q: A researcher interested in explaining the income levels of St. Lucian workers, developed the…
A: From the given information, γ is the coefficient of the variable 'EXP'. The t-ratio for the variable…
Q: When estimating the parameters of a linear regression model, the OLS estimator is a scalar value and…
A: Note: Hi there! Thank you for posting the question. As you have posted multiple questions, as per…
Q: model involving 30 observations, the following estimated regression equation was obtained. ŷ = 170…
A: We know that the regression model is y^=β0+β1x+β2x2 where β0 is constant β1 is the coefficient on…
Q: In a comprehensive road test on all new car models, one variable measured is the time it takes a car…
A: Coefficient of determination: (R2) R2 is often called the proportion of variation explained by the…
Q: A researcher collected data on the cholesterol level, CC, and the age, AA, of 24 people selected at…
A: Given hypothesis , H0 : β = 0 H1 : β ≠0 The test statistic to test the hypotheses for slope is ,…
Q: A sociologist investigating the recent upward shift in homicide trends throughout the country…
A: Test for heteroscedasticity: The null and alternate hypotheses are stated below: Null hypothesis H0:…
Q: The following table indicates the ages of a sample of female employees of People Plus Pty, and the…
A: The data shows the ages of a sample of female employees of people plus Pty, and the corresponding…
Q: In a simple linear regression with n = 300, how large must R² be in order for there to be…
A: Given information: The sample size is n = 300. The number of predictor variables is k = 1. The test…
Q: The number of initial public offerings of stock issued in a 10-year period and the total proceeds of…
A: Step-by-step procedure to find the 95% prediction interval for the proceeds when the number of…
Q: The table below shows the numbers of new-vehicle sales (in thousands) for Company 1 and Company 2…
A:
Q: Consider an estimated linear regression model with a response Y and 4 predictors X1, X2, X3, X4. For…
A: Given y=βo+β1X1+β2X2+β3X3+β4X4+e k=5=number of parameter n=number of observation=25 R=0.859825564
Q: Consider a multiple regression model for predicting the total number of runs scored by a Major…
A: Coefficient of determination is given by, R2= 1-MSE/MST Here MSE=445.18936 and MST= 445.18936+12707…
Q: Use the Durbin-Watson test to test, at 5% level of significance, for the presence of significant…
A: Null Hypothesis: H0: There is no significant linear correlation among the error terms. Alternative…
Q: Consider the set of ordered pairs shown below. Assuming that the regression equation is y = 4.293…
A: Given : The regression equation is: Y^=4.2917+0.2083X \hat Y = 4.2917 + 0.2083 X Now that we have…
Q: Consider the fitted values from a simple linear regression model with intercept: yˆ = 5 + 6x. Assume…
A:
Q: Calculate for the coefficient b in the linear regression equation describing the sample data below…
A: From the given information, X Y 0.0721 0.3891 0.0966 0.4375 0.1238 0.4704 0.1661 0.5089…
Q: A random sample of twelve students were chosen, and their midterm test score (y), as- signment score…
A: Given, Midterm Score, y Assignment Score, x1 Classes Missed, x2 85 74 76 90 85 87 94 98…
Q: Given the simple regression model Y = Bo + B,X and the regression results that follow, test the null…
A:
Q: The number of initial public offeringe of stock issued in a 10-year period and the total proceeds of…
A: The regression equation is given as : y^=32.641x +17627.405 The prediction interval is the…
Q: Consider the multiple regression model shown next between the dependent variable Y and four…
A:
Q: The accompanying data resulted from an experiment in which weld diameter and shear strength (in…
A: Here, the line of regression is given as: Strength = -941.6992 + 8.5988*Diameter Let, Strength be…
Q: 1a. Develop an estimated regression equation for these data. 1b. Compute the residuals and…
A: The regression output obtained in excel is as follows Coefficients Standard Error t Stat…
Q: Suppose we run the following regression JobStr B1 +B2 M+B Erp+ B, Edu + u to explain an individual's…
A: Given regression equation JobStr=β1+β2M+β3Exp+β4Edu+u The sample size =300The number of independent…
Q: A student uses the given set of data to compute a least-squares regression line and a correlation…
A: Here, sample size 'n' is 7. The linear regression line is given by: x y x2 y2 xy 0.7 1 0.49 1…
Q: The marketing manager of a large supermarket chain would like to use sheif space to predict the…
A: We have to answer question on durdin Watson test.
Q: Knowing the value of R2, the sample size n, and the number of explanatory variables, k, is enough to…
A: The F test statistic for the joint significance of the coefficients of the explanatory variables of…
Q: A Ross MAP team is currently developing a regression model to explain the travel expense of HR…
A: Given:
Q: The following results were obtained when each of a series of standard silver solutions was analyzed…
A: Hello! As you have posted more than 3 sub parts, we are answering the first 3 sub-parts. In case…
Q: Use the information from a simple linear regression given in the table below to calculate a 95%…
A:
Q: A researcher developed a regression model to predict the cost of a meal based on the summated…
A: Solution: Given information: n= 12 observation β1^=1.4379 Slope of the regression equation…
Q: Tests were run on 10 mice, each having a tumor of size 4 grams, by varying the amount of the drug…
A: The quadratic regression is an extension of the simple linear regression. It is also known as a…
Q: 3. The signal (peak area) measured for different standard concentrations of silver in atomic…
A: From the given information, Consider, Y = peak area that needs to be measured and X1 =Ag , X2 =…
Q: The given quantities below were calculated from a sample data set. Ev = 209 ry = 2706 = 241 XY =…
A: We want to find estimate of y and correlation (r)
Q: Consider the multiple regression model shown next between the dependent variable Y and four…
A: Solution: Given information: n= 35 observation k = 4 independent variables Sum of square of…
Q: The estimated regression equation for a model involving two independent variables and 65…
A: y^ = β0 + β1x
Q: Consider the following diagnostics table from a multiple linear regression with 2 covariates: ID…
A: "Since you have posted a question with multiple sub-parts, we will solve the first three sub-parts…
Q: The table below shows the numbers of new-vehicle sales (in thousands) for Company 1 and Company 2…
A: The data shows the numbers of new-vehicle sales (in thousands) for Company 1 and Company 2 for 11…
Q: The accompanying table lists the number of registered automatic weapons (in thousands) along with…
A: The dependent variable is "Murder Rate", and the independent variables are "Automatic Weapons, and…
Q: A university offers supplemental instruction (SI) for introductory chemistry students three times a…
A: Let x=# of SI visits and y=final class average.
Q: The number of initial public offerings of stock issued in a 10-year period and the total proceeds…
A: GivenData of Issues and Proceeds as shown below The mean of X and Y are calculated as shown…
Q: For variables x1, x2, x3 and y satisfying the assumptions for multiple linear regression inferences,…
A:
Q: A random sample of 10 individuals is selected from a population, and measurements on two variables…
A:
Q: SUMMARY OUTPUT Regression Statistics Multiple R R Square Adjusted R Square Standard Error…
A: Concept: coefficient of determination determine the amount of variation in dependent variable that…
Q: A rescarcher interested in explaining the level of foreign reserves for the country of Barbados…
A: Note: Since we only answer up to 3 sub-parts, we'll answer the first 3. Please resubmit the question…
Q: Consider the following linear regression model: Yi = B1 + Bzrzi + Bzæ3i + ei What is the weight to…
A: given a regression model yi=beta1+beta2*x2i+beta3*x3i +ei and varience…
Q: In a regression model involving 30 observations, the following estimated regression equation was…
A:
Answer accurately all three subparts.
Trending now
This is a popular solution!
Step by step
Solved in 5 steps
- A random sample of twelve students were chosen, and their midterm test score (y), as- signment score (x1), and missed classes (x2) were recorded as follows: Midterm Score, y Assignment Score, x1 Classes Missed, x2 85 74 76 90 85 87 94 98 81 91 76 74 65 50 55 65 55 70 65 70 55 70 50 55 5 7 5 2 6 3 2 5 4 3 1 4 (i) What is the fitted multiple linear regression equation of the form yˆ = b0 + b1x1 + b2x2? (ii) From part (i) above, estimate the midterm test score grade for a student who has an assignment score of 60 and missed 4 classes.A researcher notes that, in a certain region, a disproportionate number of software millionaires were born around the year 1955. Is this a coincidence, or does birth year matter when gauging whether a software founder will besuccessful? The researcher investigated this question by analyzing the data shown in the accompanying table. Complete parts a through c below. a. Find the coefficient of determination for the simple linear regression model relating number (y) of software millionaire birthdays in a decade to total number (x) of births in the region. Interpret the result. The coefficient of determination is 1.___? (Round to three decimal places as needed.) This value indicates that 2.____ of the sample variation in the number of software millionaire birthdays is explained by the linear relationship with the total number of births in the region. (Round to one decimal place as needed.) b. Find the coefficient of determination for the simple linear regression model…Years of Work Experience and number of Job Offers of 10 job-seekers were as follows: Work Exp. 4 2 5 3 7 12 2 5 4 9 No. of Offers 7 1 8 4 13 19 3 11 9 15 a. Fit the regression equation of No. of Job Offers on Years of Work Experience. b. What will be the predicted number of offers for an applicant with 6 years of experience? c. Verify the relationship between the number of job offers and years of work experience using at least two relevant methods
- The Update to the Task Force Report on Blood Pressure Control in Children [12] reported the observed 90th per-centile of SBP in single years of age from age 1 to 17 based on prior studies. The data for boys of average height are given in Table 11.18. Suppose we seek a more efficient way to display the data and choose linear regression to accomplish this task. age sbp 1 99 2 102 3 105 4 107 5 108 6 110 7 111 8 112 9 114 10 115 11 117 12 120 13 122 14 125 15 127 16 130 17 132 Do you think the linear regression provides a good fit to the data? Why or why not? Use residual analysis to justify your answer. Am I supposed to run a residual plot and QQ-plot for this question?The article “Models for Assessing Hoisting Times of Tower Cranes” (A. Leung and C. Tam, Journal of Construction Engineering and Management, 1999: 385–391) presents a model constructed by a stepwise regression procedure to predict the time needed for a tower crane hoisting operation. Twenty variables were considered, and the stepwise procedure chose a nine-variable model. The adjusted R2 for the selected model was 0.73. True or false: a) The value 0.73 is a reliable measure of the goodness of fit of the selected model. b) The value 0.73 may exaggerate the goodness of fit of the model. c) A stepwise regression procedure selects only variables that are of some use in predicting the value of the dependent variable. d) It is possible for a variable that is of no use in predicting the value of a dependent variable to be part of a model selected by a stepwise regression procedure.Which of the multivariate regression parameters listed below would be best interpreted as: the predicted value on the dependent variable when all of the independent variables in the model are equal to zero. a b1 X1 R2
- The marketing manager of a supermarket chain would like to determine the effect of shelf spaceon the sales of pet food. A random sample of 10 stores was selected, and the results are presentedbelow. Store shelf space in cm weekly sales in thousand pesos 1 45 18 2 45 21 3 75 15 4 80 18 5 95 23 6 100 26 7 135 22 8 140 27 9 185 25 10 190 28 d. Using the estimated simple linear regression equation Y=15.6414+0.0611X, estimate the weekly sales when theshelf space is 230cm? 250cm? e. Compute the coefficient of determination and interpret its value.A random sample of 10 individuals is selected from a population, and measurements on two variables (X and Y) are obtained, as seen in the table below. Individual X Y 1 9 6 2 4 4 3 6 5 4 8 5 5 9 5 6 8 6 7 4 4 8 8 6 9 7 5 10 9 6 Assuming all the model assumptions are met, and the inference procedures are valid, then: a. to calculate the value of the y-intercept of the fitted regression line. b. calculate the value of the slope of the fitted regression line.Consider the multiple regression model shown next between the dependent variable Y and four independent variables X1, X2, X3, and X4, which results in the following function:Ŷ = 33 + 8X1 − 6X2 + 16X3 + 18X4For this model, there were 35 observations; SSR = 1,544 and SSE = 600. Assume a 0.01 significance level.Based on the given information, which of the following conclusions is correct about the statistical significance of the overall model? Multiple Choice Reject the null hypothesis that β3 = 0. Do not reject the null hypothesis that β1 = β2 = β3 = β4 = 0. Reject the null hypothesis that β1 = 0. Reject the null hypothesis that β1 = β2 = β3 = β4 = 0.
- The number of initial public offerings of stock issued in a 10-year period and the total proceeds of these offerings (in millions) are shown in the table. Construct and interpret a 95% prediction interval for the proceeds when the number of issues is 569.The equation of the regression line is y=32.409x+17,285.501. Issues, x 410 467 679 499 497 394 62 53 189 174 Proceeds, y 18,223 28,066 43,757 31,337 35,488 35,312 22,180 10,660 30,384 28,416 Construct and interpret a 95% prediction interval for the proceeds when the number of issues is 569. Select the correct choice below and fill in the answer boxes to complete your choice. (Round to the nearest million dollars as needed. Type your answer in standard form where "3.12 million" means 3,120,000.) A. There is a 95% chance that the predicted proceeds given 569 issues is between $____ and $____. B. We can be 95% confident…The accompanying data resulted from an experiment in which weld diameter and shear strength (in pounds) were determined for five different spot welds on steel. Below are the data collected and the regression equation. Diameter Strength 200.1 813.7 210.1 785.3 220.1 960.4 230.1 1118.0 240.0 1076.2 Strength = -941.6992 + 8.5988*Diameter The predicted y-hat value for a diameter of 201 is 864. if we observed a weld that had a diameter of 235 that had a strength 1000, what would be its residual?A sixth-grade teacher believes that there is a relationship between his students’ IQscores (y) and the numbers of hours (x) they spend watching television each week. Thefollowing table shows a random sample of 7 sixth-grade students.y 125 116 97 114 85 107 105x 5 10 30 16 41 28 21 Does the data provide sufficient evidence to indicate that the simple linear regressionmodel is appropriate to describe the relationship between x and y? Perform a model utilitytest at α = 0.05. (Give H0, Ha, rejection region, observed test statistic, P-value, decisionand conclusion.)Find the Pearson sample correlation coefficient between x and y. Then interpretthe result.