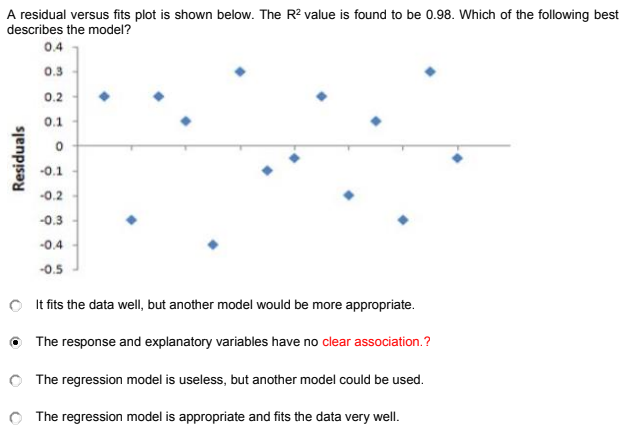
A residual versus fits plot is shown below. The R? value is found to be 0.98. Which of the following best describes the model? 0.4 0.3 0.2


Q: You manage a risky portfolio with E(r) =18% and o = 28%. The T-Bill rate is 8%. Suppose that your…
A: Question 1) Given that - Manage a risky portfolio with E(r) =18% and o = 28%. The T-Bill rate is…
Q: b) Use exponential smoothing with a smoothing constant of 0.30 to forecast the sales. Assume that…
A:
Q: For the data and sample regression equation shown below, complete parts (a) through (c). X 9 11 5 70…
A: Regression Equation: The Regression Equation is used to predict the response or dependent variable y…
Q: A normal probability plot for the residuals of a regression analysis is used to check what…
A:
Q: Find the forecast for the month of May using the exponential smoothing method Demand data Jan 32.1…
A: Given information and calculation is shown below Month Actual Demand Forecast January…
Q: 4 5. 2. Residuals
A: model is bad if the fit of best line is horizontal line and parallel to x-axis. And The vertical…
Q: Using the data below, what is the value of the absolute percent error for week 3? WeekTime Series…
A:
Q: Suppose you are interested in estimating how class size affects learning and performance, you…
A: The following regression model is given: Test score = α + β1 Class size + β2 SAT + β3 H S pers + u.
Q: Using the accompanying Home Market Value data, develop a multiple linear regression model for…
A: Consider the provided data which is used to predict the Home Market value based on the other…
Q: Johnson Plastics Inc. produces cases for CDs. The accounting manager has calculated a regression to…
A: Given Information : Regression estimate is $5,000 R-squared of 0.9 t-value of 2.5 standard error…
Q: ppose X has an exponential distribution with mean equal to 15. Determine the following: P(X > 10)…
A: We have given that Mean = 15 X~exponentia(λ) This continuous distribution. I want to find some…
Q: Which of the following points are not true when conducting a multiple regression? Select one: a.…
A: Multiple regression is used to analyze the relationship between a single dependent variable and…
Q: From the below data perform a multiple regression. What is the R2 ? How much of this R2 can be…
A: Procedure to obtain regression equation using Excel: Enter the data in an excel sheet. Go to Data…
Q: 2. I surveyed 150 adults in the U.S. and asked them how many hours of TV the watched on average per…
A: We know that, regression equation for the above situation is given by, Y= a+b1X1+b2X2+b3X3+b4X4…
Q: Q9. Using the diagram below Deviation from mean of Y TSS Error→ ESS Explained by regression→ RSS…
A: We have given the statement about the regression line.
Q: To investigate the relationship between the milage and sales price for a popular car model the…
A: The variable x represents the mileage and y represents the sales price for a popular car model. The…
Q: The data table found below contains the listed prices and weights of the diamonds in 20 rings…
A: R-squared (R2) is a statistical measure that represents the proportion of the variance for a…
Q: For the data and sample regression equation shown below, complete parts (a) through (c). -6 -8 -2 -4…
A: Solution: The estimated regression equation is y^= 6+2x
Q: The accompanying Credit Approval Decisions data provide information on credit history for a sample…
A: Given information: The response variable is Credit score and the predictor variables are Years of…
Q: a. What is sb1? What is the test statistic for Fall? What is the range of P-value forthe Intercept…
A:
Q: Using results from the previous regression model, discuss whether you would have confidence in this…
A: To have confidence in this multiple regression model to predict expected salary based on GPA, age,…
Q: Here is the Excel output for a multiple regression analysis. Study the ANOVA table, the t ratios,…
A: Regression is a statistical way to estimate the statistical relation between the variables. It can…
Q: The scatter plot shows the relationship between two variables, along with the results of a linear…
A:
Q: The regression equation below was estimated using a random sample of 27 pairs X, y observations.…
A: Given that there are 27 samples. that is n=27. There are 3 independent variables and 1 dependent…
Q: Figure on the next page shows three residual plots and a normal probability plot of residuals. For…
A: Assumption for regression inferences: Population regression line: There exists constants β0 and β1,…
Q: Fit a regression model to estimate wheat production from the following. AISo reply the questions…
A: Regression analysis is a statistical method used for the estimation of the relationship between two…
Q: Time Series Week Value 1 11 16 3 15 4 14 15 6 14 7 16 8 17 15 10 13
A: Mean of absolute percentage error: M=1n∑t=1n At-FtAt Mean of Absolute Value of forecast error:…
Q: Find the regression equation, letting the diameter be the predictor (x) variable. Find the best…
A: Solution: Let X be the diameter and Y be the circumference. The given data is
Q: For the data and sample regression equation shown below, complete parts (a) through (c). 0 2 7 7…
A:
Q: A) Which point from the data has the largest residual? (x,y) B) Explain what the residual means in…
A: Given data: Swim Time (x) Heart Rate (y) 34.13 144 35.72 152 34.71 124 34.04 140 34.12…
Q: A simple linear regression model was used to describe the relationship between y = hardness of…
A: Given : SSR = 1235.470 SST = 25221.368 n = 16
Q: For the provided data, develop a regression model for overall satisfaction as a function of years…
A: Given: Department Years Ideas Communication Recognition Training Work Conditions…
Q: For the data below: a. Find the regression equation for predicting Y from X. b. Calculate the…
A: Given, The data which contains 4 observations.
Q: For the data and sample regression equation shown below, complete parts (a) through (c). y = 6 + 2x…
A:
Q: Run a regression analysis on the following bivariate set of data with y as the response variable.…
A: The data set is given below : X Y 75.9 42.1 82.2 42.2 75.2 42.5 82.2 42.2…
Q: The summary statistics for number of colonies and year are listed below. The correlation between…
A: "Since you have posted a question with multiple subparts, we will solve first 3 sub-parts for you.…
Q: 13. Find the regression equation, letting the diameter be the predictor (x) variable. Find the best…
A: Use EXCEL to obtain the regression equation. EXCEL procedure: Go to EXCEL Go to Data>Data…
Q: Answer the problem and show your solution: The shaded region is on the right tail of the…
A:
Q: Using your favorite statistics software package, you generate a scatter plot which displays a linear…
A:
Q: a. How many apartment buildings were in the sample? b. Write the estimated regression equation (to 2…
A: a) Sample size n = 9 b)The regression line is y = 20+7.28x c)p-value = 0.00044 p-value is less…
Q: Using your favorite statistics software package, you generate a scatter plot which displays a linear…
A: Given information: y = 3.2 + 1.29x σX=1.37σY=4.2 The coefficient of determination is the proportion…
Q: Data were collected to explain the number of wins an NFL team has based on the average points per…
A: Solution: Given information: n= 11 observation. k= 1 independent variable The estimated regression…
Q: Q2. Adjusted R2 is the modified version of R after adjusting for the number of predictor variables…
A: The adjusted R2 helps to measure the relationship between two variables in the regression analysis.…
Q: For the data below: a. Find the regression equation for predicting Y from X. b. Calculate the…
A: Step-by-step procedure to find the regression equation using Excel: In Excel sheet, enter X in one…
Q: For the data given below, fill in the blanks, using Formulas, Descriptive Statistics and Regression…
A: Hey there! Thank you for posting the question. Since you have posted a question with multiple…
Q: Consider the following data of Regression Model where YACTUAL is your actual observation and…
A: Given the data; Yactual 12.6 9.8 9.6 9.9 11.5 11.2 12.3 9.5 9.7 12.4 Ypredicted 12.8 9.1 9.7…
Q: Q9. Using the diagram below Deviation from mean of Y TSS Error → ESS Explained by regression→ RSS…
A: The relation between TSS , RSS and ESS is given by, TSS=RSS+ESS Where TSS is the total sum of…
Q: From the sample data above, perform the following steps. a. Create a regression model that includes…
A: Enter given data in R :…
Q: Using your favorite statistics software package, you generate a scatter plot which displays a linear…
A:
Q: A residual versus fits plot is shown below. The R? value is found to be 0.00. Which of the following…
A: Given: Residual plot and R2=0
8


Trending now
This is a popular solution!

Step by step
Solved in 2 steps

- XYZ Corporation Stock Prices The following table shows the average stock price, in dollars, of XYZ Corporation in the given month. Month Stock price January 2011 43.71 February 2011 44.22 March 2011 44.44 April 2011 45.17 May 2011 45.97 a. Find the equation of the regression line. Round the regression coefficients to three decimal places. b. Plot the data points and the regression line. c. Explain in practical terms the meaning of the slope of the regression line. d. Based on the trend of the regression line, what do you predict the stock price to be in January 2012? January 2013?Noise and Intelligibility Audiologists study the intelligibility of spoken sentences under different noise levels. Intelligibility, the MRT score, is measured as the percent of a spoken sentence that the listener can decipher at a cesl4ain noise level in decibels (dB). The table shows the results of one such test. (a) Make a scatter plot of the data. (b) Find and graph the regression line. (c) Find the correlation coefficient. Is a linear model appropriate? (d) Use the linear model in put (b) to estimate the intelligibility of a sentence at a 94-dB noise level.Special Rounding Instructions For this exercise set, round all regression parameters to three decimal places, but round all other answers to two decimal places unless otherwise indicated. Postal RatesThe table below shows the cost s, in cents, of a domestic first-class postage stamp in the United States tyears after 1900. t=time,inyearssince1900 s=costofstamp 19 2 32 3 58 4 71 8 78 15 85 22 95 32 102 37 109 44 116 47 a.Use exponential regression to model s as an exponential function of t. b.What cost does your model give for a 1988 stamp? Report your answer to the nearest cent. The actual cost was 25cents. c.Plot the data and the exponential model.
- Special Rounding Instructions For this exercise set, round all regression parameters to three decimal places, but round all other answers to two decimal places unless otherwise indicated. First Down The following table shows the probability P, as a percentage, of a college football team converting on fourth down when not goal to go versus the distance D, in yards, to the first down maker. 28 D = distance, in yards P = probability 1 70 2 60 3 53 4 46 5 41 6 37 7 34 8 32 a.Use exponential regression to model the data. b.Plot the data along with the exponential model. c.What probability does the model give of gaining a first down for fourth down and 10yards to go? Note: the actual probability is 28.Remainder Round all answers to two decimal places unless otherwise indicated. Gross Domestic Product U.S. gross domestic product, in trillions of dollars, is given in the table below. Date Gross domestic product 2010 15.0 2011 15.5 2012 16.2 2013 16.7 a.Find the equation of the regression line, and explain the meaning of its slope. Round regression line parameters to two decimal places. b.Plot the data points and the regression line. c.When would you predict that a gross domestic product of 17.3 trillion dollars would be reached? The actual gross domestic product in 2014 was 17.3 trillion dollars. What does that say about your prediction?Below is the Excel output of a regression. (a) What is the regression model? (b) If represents cost and represents usage, what does the model tell? (c) What is and ? (d) Can we conclude at that and are significantly correlated? Why (e) Find a 95% confidence interval for the slope . (Note: For your convenience, you can copy/ paste the following notations.)
- For the regression with Percent Water causing International Migration per 1000, is the result statistically significant? How do you know? A It is impossible to tell without knowing the confidence level. B The coefficient is high C The p value is low D The coefficient is low E The p value is highThe individual residual scores from a sample of participants regarding the difference between the predicted Y values from a regression equation and the actual Y values from the data are provided here: Y - Ŷ = 3, 8, 1, 2, 2. What is the value for the standard error of the estimate? a. 3.65 b. 1.45 c. 2.31 d. 4Q.1 q8- Which of the following statistics can be used to assess out-of-sample predictive ability of the model? Select one: a. Adjusted R2 b. Standard error of regression c. R2 d. Theil's U2

