A simple random sample of eight drivers was selected. All eight drivers are insured with the same insurance company, and all have similar car insurance p The aim is to see whether driving experiences determine insurance premiums. The following table lists their driving experiences (in years) and monthly auto insurance premiums: Driving experience (years) 5 2 12 9| 15 6 | 25 16 Monthly 64 77 50 71 44 56 42 60 auto insurance premium (S) Create a scatter plot and interpret the scatter plot. Calculate the sample correlation coefficient (Pearson). Hint: You need to use R. For your convenience, here are the dataset in R. driving.years <- c(5.2,12,9,15,6,25,16) premium <-c(64,77,50,71,44,56,42,60) O There is a quite linear, negative and moderate relationship between premium and driving experience. The sample correlation is -0.675. O There is a quite linear, negative and moderate relationship between premium and driving experience. The sample correlation is -0.775. O There is no relationship between premium and driving experience. The sample correlation is -0.00775. O There is no relationship between premium and driving experience. The sample correlation is -0.775.
A simple random sample of eight drivers was selected. All eight drivers are insured with the same insurance company, and all have similar car insurance p The aim is to see whether driving experiences determine insurance premiums. The following table lists their driving experiences (in years) and monthly auto insurance premiums: Driving experience (years) 5 2 12 9| 15 6 | 25 16 Monthly 64 77 50 71 44 56 42 60 auto insurance premium (S) Create a scatter plot and interpret the scatter plot. Calculate the sample correlation coefficient (Pearson). Hint: You need to use R. For your convenience, here are the dataset in R. driving.years <- c(5.2,12,9,15,6,25,16) premium <-c(64,77,50,71,44,56,42,60) O There is a quite linear, negative and moderate relationship between premium and driving experience. The sample correlation is -0.675. O There is a quite linear, negative and moderate relationship between premium and driving experience. The sample correlation is -0.775. O There is no relationship between premium and driving experience. The sample correlation is -0.00775. O There is no relationship between premium and driving experience. The sample correlation is -0.775.

Holt Mcdougal Larson Pre-algebra: Student Edition 2012
1st Edition
ISBN:9780547587776
Author:HOLT MCDOUGAL
Publisher:HOLT MCDOUGAL
Chapter11: Data Analysis And Probability
Section: Chapter Questions
Problem 8CR

Related questions
Question
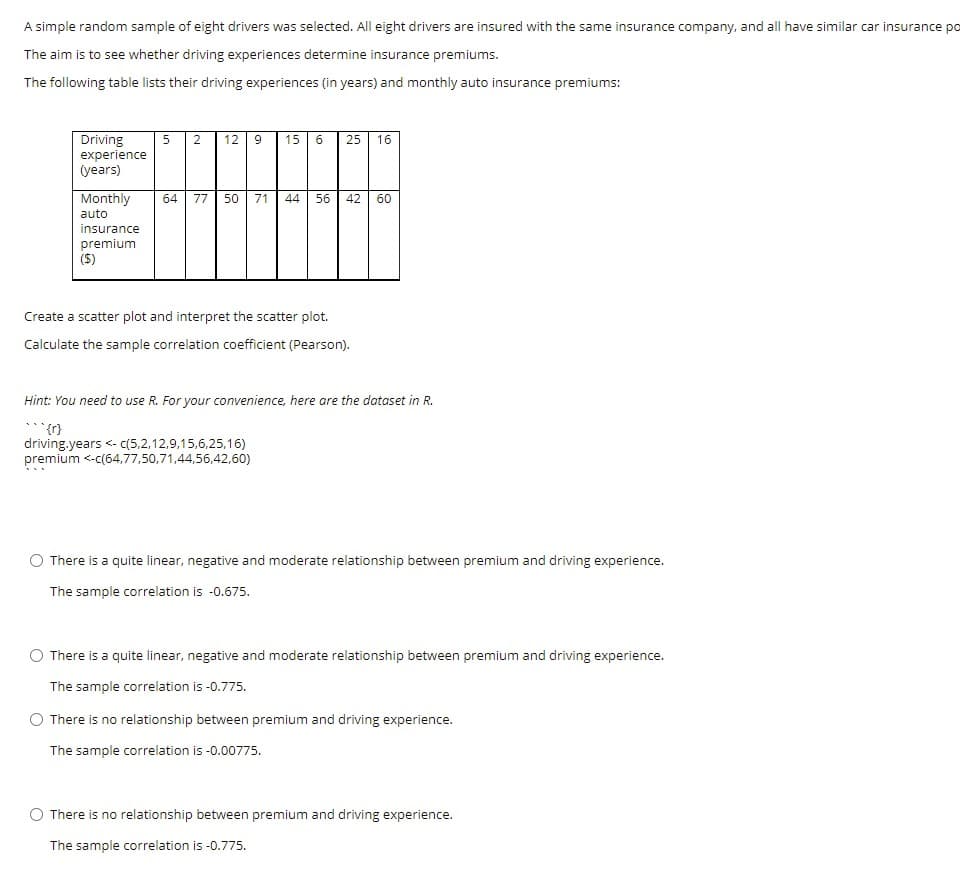
Transcribed Image Text:A simple random sample of eight drivers was selected. All eight drivers are insured with the same insurance company, and all have similar car insurance po
The aim is to see whether driving experiences determine insurance premiums.
The following table lists their driving experiences (in years) and monthly auto insurance premiums:
Driving
experience
(years)
5 2
12
15
25
16
Monthly
auto
64
77
50
71
44
56
42
60
insurance
premium
(S)
Create a scatter plot and interpret the scatter plot.
Calculate the sample correlation coefficient (Pearson).
Hint: You need to use R. For your convenience, here are the dataset in R.
{1},..
driving.years <- (5,2,12,9,15,6,25,16)
premium <-c(64,77,50,71,44,56,42,60)
There is a quite linear, negative and moderate relationship between premium and driving experience.
The sample correlation is -0.675.
O There is a quite linear, negative and moderate relationship between premium and driving experience.
The sample correlation is -0.775.
O There is no relationship between premium and driving experience.
The sample correlation is -0.00775.
There is no relationship between premium and driving experience.
The sample correlation is -0.775.
Expert Solution
This question has been solved!
Explore an expertly crafted, step-by-step solution for a thorough understanding of key concepts.

This is a popular solution!

Trending now
This is a popular solution!

Step by step
Solved in 3 steps with 1 images

Recommended textbooks for you
Holt Mcdougal Larson Pre-algebra: Student Edition…
Algebra
ISBN:
9780547587776
Author:
HOLT MCDOUGAL
Publisher:
HOLT MCDOUGAL
Holt Mcdougal Larson Pre-algebra: Student Edition…
Algebra
ISBN:
9780547587776
Author:
HOLT MCDOUGAL
Publisher:
HOLT MCDOUGAL