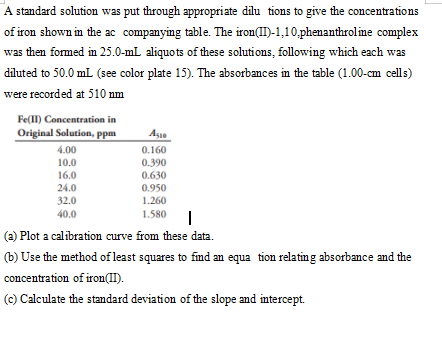
A standard solution was put through appropriate dilu tions to give the concentrations of iron shown in the ac companying table. The iron(II)-1,10,phenanthroline complex was then formed in 25.0-mL aliquots of these solutions, following which each was dluted to 50.0 mL (see color plate 15). The absorbances in the table (1.00-cm cells) vere recorded at 510 nm Fe(II) Concentration in Original Solution, Ppm 4.00 0.160 10.0 16.0 24.0 0.390 0.630 0.950 32.0 1.260 40.0 1.580 a) Plot a calibration curve from these data. b) Use the method of least squares to find an equa tion relating absorbance and the concentration of iron(II). c) Calculate the standard deviati on of the slope and intercept.
A standard solution was put through appropriate dilu tions to give the concentrations of iron shown in the ac companying table. The iron(II)-1,10,phenanthroline complex was then formed in 25.0-mL aliquots of these solutions, following which each was dluted to 50.0 mL (see color plate 15). The absorbances in the table (1.00-cm cells) vere recorded at 510 nm Fe(II) Concentration in Original Solution, Ppm 4.00 0.160 10.0 16.0 24.0 0.390 0.630 0.950 32.0 1.260 40.0 1.580 a) Plot a calibration curve from these data. b) Use the method of least squares to find an equa tion relating absorbance and the concentration of iron(II). c) Calculate the standard deviati on of the slope and intercept.

Principles of Instrumental Analysis
7th Edition
ISBN:9781305577213
Author:Douglas A. Skoog, F. James Holler, Stanley R. Crouch
Publisher:Douglas A. Skoog, F. James Holler, Stanley R. Crouch
Chapter14: Applications Of Ultraviolet-visible Molecular Absorption Spectrometry
Section: Chapter Questions
Problem 14.19QAP

Related questions
Question
Transcribed Image Text:A standard solution was put through appropriate dilu tions to give the concentrations
of iron shown in the ac companying table. The iron(II)-1,10,phenanthroline complex
was then formed in 25.0-ml aliquots of these solutions, following which each was
diluted to 50.0 mL (see color plate 15). The absorbances in the table (1.00-cm cells)
were recorded at 510 nm
Fe(II) Concentration in
Original Solution, ppm
Aşie
4.00
0.160
0.390
10.0
16.0
0.630
24.0
0.950
32.0
1.260
40.0
1.580
(a) Plot a calibration curve from these data.
(b) Use the method of least squares to find an equa tion relatin g absorbance and the
concentration of iron(II).
(c) Calculate the standard deviation of the slope and intercept.
Expert Solution
This question has been solved!
Explore an expertly crafted, step-by-step solution for a thorough understanding of key concepts.

This is a popular solution!

Trending now
This is a popular solution!

Step by step
Solved in 6 steps with 6 images

Recommended textbooks for you
Principles of Instrumental Analysis
Chemistry
ISBN:
9781305577213
Author:
Douglas A. Skoog, F. James Holler, Stanley R. Crouch
Publisher:
Cengage Learning

Principles of Instrumental Analysis
Chemistry
ISBN:
9781305577213
Author:
Douglas A. Skoog, F. James Holler, Stanley R. Crouch
Publisher:
Cengage Learning