
Principles of Instrumental Analysis
7th Edition
ISBN: 9781305577213
Author: Douglas A. Skoog, F. James Holler, Stanley R. Crouch
Publisher: Cengage Learning
expand_more
expand_more
format_list_bulleted
Videos
Textbook Question
Chapter 14, Problem 14.6QAP
The accompanying data (1.00-cm cells) were obtained for the spectrophotometric titration 10.00 mL of Pd(II) with 2.44 × 10⁻⁴ M Nitroso R(O. W Rollins and M. M. Oldham, Anal. chem .,1971, 43, 262, DOI: 10.1021/ac60297a026).
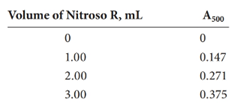
Calculate the concentration of the Pd(II) solution, given that the ligand-to-cation ratio in the colored product is 2:1
Expert Solution & Answer

Trending nowThis is a popular solution!

Students have asked these similar questions
A 25.0 cm portion of 0.200, mol dm^-3 sodium ethanedioate solution was warmed and titrated against a solution of potassium manganate(VII). If 17.2 cm^3 of potassium manganate(VII) are required, what is its concentration?
10-mL aliquots of an environmental water sample were pipetted into five 50.00-mL volumetric flasks. Exactly 0.00, 5.00, 10.00, 15.00, and 20.00-mL of a standard solution containing 11.1 ppm Fe3+ were added to each, followed by an excess of thiocyanate ion to give the red complex Fe(SCN)2+. After dilution to volume, the instrumental response for each of the five solutions measured with a colorimeter was found to be 0.240, 0.437, 0.621, 0.809, 1.809, respectively.
Using Excel and the LINEST function, what was the concentration in the water sample (including error)? [HINT: consider the type of calibration scheme used.]
A 0.6025 g sample was dissolved and the Ca2+ and Ba2+ ions present were precipitated as BaC2O4.H2O and CaC2O4.H2O. The oxalates were then heated in a thermogravimetric apparatus leaving a residue that weighed 0.5713 g in the range 320oC to 400oC and 0.4674 g in the range 580oC to 620oC. Calculate the percentage Ba in the sample.
Chapter 14 Solutions
Principles of Instrumental Analysis
Ch. 14 - Prob. 14.1QAPCh. 14 - A 0.4740-g pesticide sample was decomposed by wet...Ch. 14 - Sketch a photometric titration curve for the...Ch. 14 - Prob. 14.4QAPCh. 14 - Prob. 14.5QAPCh. 14 - The accompanying data (1.00-cm cells) were...Ch. 14 - A 3.03-g petroleum specimen was decomposed by wet...Ch. 14 - Prob. 14.8QAPCh. 14 - Prob. 14.9QAPCh. 14 - The acid-base indicator HIn undergoes the...
Ch. 14 - Prob. 14.11QAPCh. 14 - Prob. 14.12QAPCh. 14 - Copper(II) forms a 1:1 complex with the organic...Ch. 14 - Aluminum forms a 1:1 complex with...Ch. 14 - Prob. 14.15QAPCh. 14 - Prob. 14.16QAPCh. 14 - Prob. 14.17QAPCh. 14 - Prob. 14.18QAPCh. 14 - Prob. 14.19QAPCh. 14 - Given the Information that...Ch. 14 - Prob. 14.21QAPCh. 14 - Mixing the chelating reagent B with Ni(II) forms...Ch. 14 - Prob. 14.23QAP
Knowledge Booster


Learn more about
Need a deep-dive on the concept behind this application? Look no further. Learn more about this topic, chemistry and related others by exploring similar questions and additional content below.Similar questions
- The acid-base indicator HIn undergoes the following reaction in dilute aqueous solution: HIncolor1H++Incolor2 The following absorbance data were obtained for a 5.00 I0-4 M solution of HIn in 0.1 M NaOH and 0.1 M HC1. Measurements were made at wavelengths of 485 nm and 625 nm with 1.00-cm cells. 0.1 M NaOH A485 = 0.075 A625 = 0.904 0.1 M HC1 A485 = 0.487 A625 = 0.181 In the NaOH solution, essentially all of the indicator is present as In-; in the acidic solution, it is essentially all in the form of HIn. (a) Calculate molar absorptivities for In- and HIn at 485 and 625 nm. (b) Calculate the acid dissociation constant for the indicator ¡fa pH 5.00 buffer containing a small amount of the indicator exhibits an absorbance of 0.567 at 485 nm and 0.395 at 625 nm (1.00-cm cells). (c) What is the pH of a solution containing a small amount of the indicator that exhibits an absorbance of0.492 at 485 nm and 0.245 at 635 nm (1.00-cm cells)? (d) A 25.00-mL aliquot of a solution of purified weak organic acid HX required exactly 24.20 mL of a standard solution of a strong base to reach a phenolphthalein end point. When exactly 12.10 mL of the base was added to a second 25.00-mL aliquot of the acid, which contained a small amount of the Indicator under consideration, the absorbance was found to be 0.333 at 485 nm and 0.655 at 625 nm (1.00-cmcells). Calculate the pH of the solution and Ka for the weak acid. (e) What would be the absorbance of a solution at 485 and 625 nm (1.50-cm cells) that was 2.00 10-4 M in the indicator and was buffered to a pH of 6.000?arrow_forwardOne common way to determine phosphorous in urine is to treat the sample after removing the protein with molybdenum (VI) and then reducing the resulting 12-molybdophosphate complex with ascorbic acid to give an intense blue-coloured species called molybdenum blue. The absorbance of molybdenum blue can be measured at 650 nm. A 24-hour urine sample was collected, and the patient produced 1122 mL in 24 hours. A 1.00 mL aliquot of the sample was treated with Mo (VI) and ascorbic acid and diluted to a volume of 50.00 mL A calibration curve was prepared by treating 1.00 mL aliquot of phosphate standard solution in the same manner as the urine sample. The absorbances of the standards and the urine sample were obtained at 650 nm and the following results were obtained. ppm, P aBSORBANCE (A) 1.003.00 0.230 2.00 0.436 3.00 0.638 4.00 0.848 Urine sample 0.518 ffind the slope and intercept, then graph it.arrow_forwardA 0.1 M solution of acid was used to titrate 10 ml of 0.1 M solution of alkali and thefollowing volumes of acid were recorded: 9.88 10.18 10.23 10.39 10.21 Calculate the 95% confidence limits of the mean and use them to decide whetherthere is any evidence of systematic error.arrow_forward
- 0 The acid-base indicator HIn undergoes the following reaction in dilute aqueous solution:HIn color1 m H1 1 In2color2The following absorbance data were obtained for a 5.00 3 1024M solution of HIn in 0.1 M NaOH and0.1 M HCl. Measurements were made at wavelengths of 485 nm and 625 nm with 1.00-cm cells.0.1 M NaOH A485 5 0.075 A625 5 0.9040.1 M HCl A485 5 0.487 A625 5 0.181In the NaOH solution, essentially all of the indicator is present as In2; in the acidic solution, it is essentiallyall in the form of HIn.(a) Calculate molar absorptivities for In2 and HIn at 485 and 625 nm.(b) Calculate the acid dissociation constant for the indicator if a pH 5.00 buffer containing a small amountof the indicator exhibits an absorbance of 0.567 at 485 nm and 0.395 at 625 nm (1.00-cm cells).(c) What is the pH of a solution containing a small amount of the indicator that exhibits an absorbance of0.492 at 485 nm and 0.245 at 635 nm (1.00-cm cells)?(d) A 25.00-mL aliquot of a solution of purified weak…arrow_forwardThe calibration curve y=0.0218x - 0.0001 for Fe2+ in buffer at 450 nm in a 0.5 cm cuvette. Is Beer's Law obeyed? Explain. and What is the molar extinction coefficient for the Fe2+ complex at 450 nm?arrow_forward4. determine the amount in mg of the amount of Ag present from ICP mass digested: 1.0821g/L dilution of 10ml stock solution to 100ml volumetric flask X=0.98 (intensity)arrow_forward
- The following calibration data were obtained by an atomic absorption spectrophotometric (AAS) method for the determination of mercury in an herbal product. (show complete solution) 1. What is the detection limit for the method? 2. What is the limit of quantitation for the method?arrow_forwardwill addition of 300ml 0.005M agno3 to 200ml of 0.004M Al2(SO4)3 result in oreciptation of Ag2SO4 if Ksp of Ag2SO4 is 6.65x10^8?arrow_forwardWhat does the %RSD, listed in the spectral data, as well as the correlation coefficient of your standard curve, tell you about the quality of the data and integrity of the results? my standard % RSD is 36.4%, I had to calculate manually from the 5 standard solutions I did have on the spectra. The R squared value from the standard curve is 0.7282arrow_forward
- A method for the analysis of Ca2+ in water suffers from an interference in the presence of Zn2+. When the concentration of Ca2+ is 100 times greater than that of Zn2+, an analysis for Ca2+ gives a relative error of +0.5%. What is the selectivity coefficient for this method?arrow_forwardA spectrophotometric method for the quantitative determination of the concentration ofPb2+ in blood yields an Ssamp of 0.133 for a 1 mL sample of blood that has been diluted to 6 mL. A second sample is spiked with 1 µL of a 1467 ppb Pb2+ standard and diluted to 6 mL, yielding an Sspike of 0.491. Determine the concentration of Pb2+ in the original sample of blood.arrow_forwardThe following data are obtained from three standard soltions using UV-Vis spectroscopy: What is the colar concentration (M) of an unknown solution with an absorbance of 0.180 at 255 nm? The unknown solution contains the same analyte as the standard solution does. The molar mass of the analyte is 188.65 g/mol a) 4.82x10⁻⁵b)1.9x10⁻³c)3.60x10⁻⁴d)1.9x10⁻⁵e)1.8x 10⁻⁴arrow_forward
arrow_back_ios
SEE MORE QUESTIONS
arrow_forward_ios
Recommended textbooks for you

 Principles of Instrumental AnalysisChemistryISBN:9781305577213Author:Douglas A. Skoog, F. James Holler, Stanley R. CrouchPublisher:Cengage Learning
 Principles of Modern ChemistryChemistryISBN:9781305079113Author:David W. Oxtoby, H. Pat Gillis, Laurie J. ButlerPublisher:Cengage Learning
Principles of Instrumental Analysis
Chemistry
ISBN:9781305577213
Author:Douglas A. Skoog, F. James Holler, Stanley R. Crouch
Publisher:Cengage Learning
Principles of Modern Chemistry
Chemistry
ISBN:9781305079113
Author:David W. Oxtoby, H. Pat Gillis, Laurie J. Butler
Publisher:Cengage Learning
Thermogravimetric Analysis [ TGA ] # Thermal Analysis # Analytical Chemistry Part-11# CSIR NET/GATE; Author: Priyanka Jain;https://www.youtube.com/watch?v=p1K-Jpzylso;License: Standard YouTube License, CC-BY