A tax preparation firm is interested in comparing the quality of work at two of its regional offices. The observed frequencies showing the number of sampled returns with errors and the number of sampled returns that were correct are as follows. Regional Office Return Office 1 Office 2 Error 38 28 Correct 216 275 a. What are the sample proportions of returns with errors at the two offices? Office 1 Office 2 P (to 2 decimals) b. Use the chi-square test procedure to see if there is a significant difference between the population proportion of error rates for the two offices. Test the null hypothesis Ho : P1 = P2 with a 0.10 level of significance. Note: We generally use the chi-square test of equal proportions when there are three or more populations, but this example shows that the same chi-square test can be used for testing equal proportions with two populations. Give the test statistic and the p-value? Use Table 3 of Appendix B. x? = (to 3 decimals. Do not round your intermediate calculation.) The p-value is - Select your answer - What is your conclusion? Select your answer - v that the two offices do not have the same population proportion error rates. c. A X test statistic or a z test statistic may be used to test the hypothesis. However, when we want to make inferences about the proportions for two populations, we generally prefer the z test statistic procedure. Comment on why the z test statistic provides the user with more options for inferences about the proportions of two populations. With populations, the test statistic x will always equal z2. The Select your answer - is preferred because it allows for Select your answer - V tailed tests. The - Select your answer - v is limited to - Select your answer - v tailed tests.
A tax preparation firm is interested in comparing the quality of work at two of its regional offices. The observed frequencies showing the number of sampled returns with errors and the number of sampled returns that were correct are as follows. Regional Office Return Office 1 Office 2 Error 38 28 Correct 216 275 a. What are the sample proportions of returns with errors at the two offices? Office 1 Office 2 P (to 2 decimals) b. Use the chi-square test procedure to see if there is a significant difference between the population proportion of error rates for the two offices. Test the null hypothesis Ho : P1 = P2 with a 0.10 level of significance. Note: We generally use the chi-square test of equal proportions when there are three or more populations, but this example shows that the same chi-square test can be used for testing equal proportions with two populations. Give the test statistic and the p-value? Use Table 3 of Appendix B. x? = (to 3 decimals. Do not round your intermediate calculation.) The p-value is - Select your answer - What is your conclusion? Select your answer - v that the two offices do not have the same population proportion error rates. c. A X test statistic or a z test statistic may be used to test the hypothesis. However, when we want to make inferences about the proportions for two populations, we generally prefer the z test statistic procedure. Comment on why the z test statistic provides the user with more options for inferences about the proportions of two populations. With populations, the test statistic x will always equal z2. The Select your answer - is preferred because it allows for Select your answer - V tailed tests. The - Select your answer - v is limited to - Select your answer - v tailed tests.

Holt Mcdougal Larson Pre-algebra: Student Edition 2012
1st Edition
ISBN:9780547587776
Author:HOLT MCDOUGAL
Publisher:HOLT MCDOUGAL
Chapter11: Data Analysis And Probability
Section11.4: Collecting Data
Problem 6E

Related questions
Question
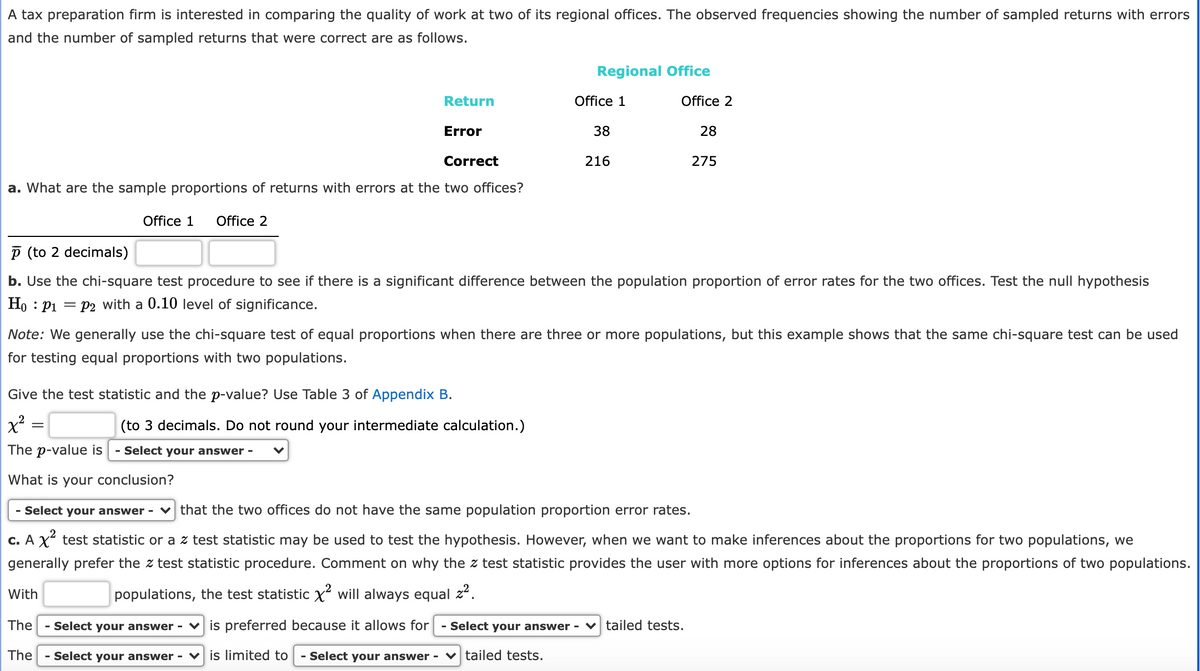
Transcribed Image Text:A tax preparation firm is interested in comparing the quality of work at two of its regional offices. The observed frequencies showing the number of sampled returns with errors
and the number of sampled returns that were correct are as follows.
Regional Office
Return
Office 1
Office 2
Error
38
28
Correct
216
275
a. What are the sample proportions of returns with errors at the two offices?
Office 1
Office 2
P (to 2 decimals)
b. Use the chi-square test procedure to see if there is a significant difference between the population proportion of error rates for the two offices. Test the null hypothesis
Ho : P1 = P2 with a 0.10 level of significance.
Note: We generally use the chi-square test of equal proportions when there are three or more populations, but this example shows that the same chi-square test can be used
for testing equal proportions with two populations.
Give the test statistic and the p-value? Use Table 3 of Appendix B.
(to 3 decimals. Do not round your intermediate calculation.)
The p-value is
- Select your answer -
What is your conclusion?
- Select your answer - v that the two offices do not have the same population proportion error rates.
c. A X² test statistic or a z test statistic may be used to test the hypothesis. However, when we want to make inferences about the proportions for two populations, we
generally prefer the z test statistic procedure. Comment on why the z test statistic provides the user with more options for inferences about the proportions of two populations.
With
populations, the test statistic X will always equal z2.
The
- Select your answer - v is preferred because it allows for
- Select your answer - ♥ tailed tests.
The
Select your answer - v is limited to
Select your answer - ♥ tailed tests.
Expert Solution
This question has been solved!
Explore an expertly crafted, step-by-step solution for a thorough understanding of key concepts.

This is a popular solution!

Trending now
This is a popular solution!

Step by step
Solved in 3 steps with 3 images

Recommended textbooks for you
Holt Mcdougal Larson Pre-algebra: Student Edition…
Algebra
ISBN:
9780547587776
Author:
HOLT MCDOUGAL
Publisher:
HOLT MCDOUGAL

College Algebra (MindTap Course List)
Algebra
ISBN:
9781305652231
Author:
R. David Gustafson, Jeff Hughes
Publisher:
Cengage Learning

Holt Mcdougal Larson Pre-algebra: Student Edition…
Algebra
ISBN:
9780547587776
Author:
HOLT MCDOUGAL
Publisher:
HOLT MCDOUGAL
College Algebra (MindTap Course List)
Algebra
ISBN:
9781305652231
Author:
R. David Gustafson, Jeff Hughes
Publisher:
Cengage Learning