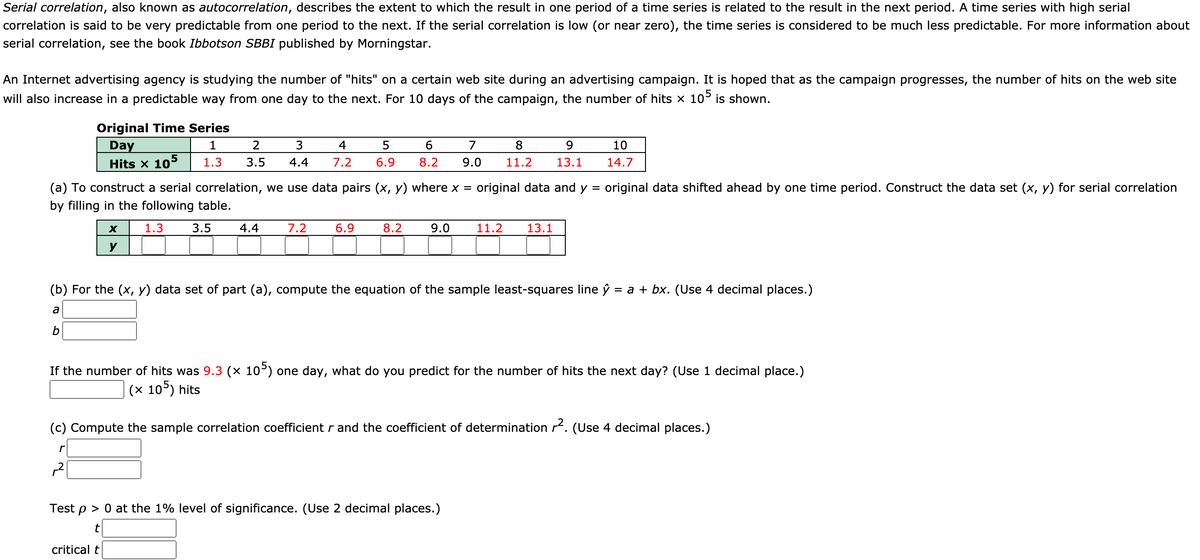
(a) To construct a serial correlation, we use data pairs (x, y) where x = original data and y = original data shifted ahead by one time period. Construct the data set (x, y) for serial correlation by filling in the following table. 1.3 3.5 4.4 7.2 6.9 8.2 9.0 11.2 13.1 y (b) For the (x, y) data set of part (a), compute the equation of the sample least-squares line ŷ = a + bx. (Use 4 decimal places.) a b If the number of hits was 9.3 (x 105) one day, what do you predict for the number of hits the next day? (Use 1 decimal place.) |(x 105) hits (c) Compute the sample correlation coefficient r and the coefficient of determination r2. (Use 4 decimal places.) Test p > 0 at the 1% level of significance. (Use 2 decimal places.) critical t

MATLAB: An Introduction with Applications
6th Edition
ISBN:9781119256830
Author:Amos Gilat
Publisher:Amos Gilat
Chapter1: Starting With Matlab
Section: Chapter Questions
Problem 1P
icon
Related questions
icon
Concept explainers
Question
Serial correlation, also known as autocorrelation, describes the extent to which the result in one period of a time series is related to the result in the next period. A time series with high serial
correlation is said to be very predictable from one period to the next. If the serial correlation is low (or near zero), the time series is considered to be much less predictable. For more information about
serial correlation, see the book Ibbotson SBBI published by Morningstar.
An Internet advertising agency is studying the number of "hits" on a certain web site during an advertising campaign. It is hoped that as the campaign progresses, the number of hits on the web site
will also increase in a predictable way from one day to the next. For 10 days of the campaign, the number of hits x 10° is shown.
Original Time Series
Day
1
2
4
7
8.
9.
10
Hits x 105
1.3
3.5
4.4
7.2
6.9
8.2
9.0
11.2
13.1
14.7
(a) To construct a serial correlation, we use data pairs (x, y) where x =
original data and y
original data shifted ahead by one time period. Construct the data set (x, y) for serial correlation
by filling in the following table.
1.3
3.5
4.4
7.2
6.9
8.2
9.0
11.2
13.1
y
(b) For the (x, y) data set of part (a), compute the equation of the sample least-squares line ý
= a + bx. (Use 4 decimal places.)
a
b
If the number of hits was 9.3 (× 10°) one day, what do you predict for the number of hits the next day? (Use 1 decimal place.)
(x 10°) hits
(c) Compute the sample correlation coefficient r and the coefficient of determination r. (Use 4 decimal places.)
Test p > 0 at the 1% level of significance. (Use 2 decimal places.)
critical t
Transcribed Image Text:Serial correlation, also known as autocorrelation, describes the extent to which the result in one period of a time series is related to the result in the next period. A time series with high serial correlation is said to be very predictable from one period to the next. If the serial correlation is low (or near zero), the time series is considered to be much less predictable. For more information about serial correlation, see the book Ibbotson SBBI published by Morningstar. An Internet advertising agency is studying the number of "hits" on a certain web site during an advertising campaign. It is hoped that as the campaign progresses, the number of hits on the web site will also increase in a predictable way from one day to the next. For 10 days of the campaign, the number of hits x 10° is shown. Original Time Series Day 1 2 4 7 8. 9. 10 Hits x 105 1.3 3.5 4.4 7.2 6.9 8.2 9.0 11.2 13.1 14.7 (a) To construct a serial correlation, we use data pairs (x, y) where x = original data and y original data shifted ahead by one time period. Construct the data set (x, y) for serial correlation by filling in the following table. 1.3 3.5 4.4 7.2 6.9 8.2 9.0 11.2 13.1 y (b) For the (x, y) data set of part (a), compute the equation of the sample least-squares line ý = a + bx. (Use 4 decimal places.) a b If the number of hits was 9.3 (× 10°) one day, what do you predict for the number of hits the next day? (Use 1 decimal place.) (x 10°) hits (c) Compute the sample correlation coefficient r and the coefficient of determination r. (Use 4 decimal places.) Test p > 0 at the 1% level of significance. (Use 2 decimal places.) critical t
Expert Solution
trending now

Trending now

This is a popular solution!

steps

Step by step

Solved in 2 steps with 2 images

Blurred answer
Knowledge Booster
Correlation, Regression, and Association
Learn more about
Need a deep-dive on the concept behind this application? Look no further. Learn more about this topic, statistics and related others by exploring similar questions and additional content below.
Recommended textbooks for you
MATLAB: An Introduction with Applications
Statistics
ISBN:
9781119256830
Author:
Amos Gilat
Publisher:
John Wiley & Sons Inc
Probability and Statistics for Engineering and th…
Statistics
ISBN:
9781305251809
Author:
Jay L. Devore
Publisher:
Cengage Learning
Statistics for The Behavioral Sciences (MindTap C…
Statistics
ISBN:
9781305504912
Author:
Frederick J Gravetter, Larry B. Wallnau
Publisher:
Cengage Learning
Elementary Statistics: Picturing the World (7th E…
Statistics
ISBN:
9780134683416
Author:
Ron Larson, Betsy Farber
Publisher:
PEARSON
The Basic Practice of Statistics
Statistics
ISBN:
9781319042578
Author:
David S. Moore, William I. Notz, Michael A. Fligner
Publisher:
W. H. Freeman
Introduction to the Practice of Statistics
Statistics
ISBN:
9781319013387
Author:
David S. Moore, George P. McCabe, Bruce A. Craig
Publisher:
W. H. Freeman