A total of 2462 American adults responded to a survey about their income class and their general health level. The table to the right summarizes their responses. Answer parts (a) through (e). Middle Income Income Class versus General Health Level Health in General Excellent Good Poor Total 203 424 144 771 Upper Income 225 57 582 274 1081 299 254 610 485 1305 672 2462 Lower Income Total a. What proportion of the lower-income adults have excellent health? (Type an integer or decimal rounded to three decimal places as needed.) b. What proportion of the middle-income adults have excellent health? (Type an integer or decimal rounded to three decimal places as needed.) c. What proportion of the upper-income adults have excellent health? Type an integer or decimal rounded to three decimal places as needed.) d. On the basis of finding the results for parts (a), (b), and (c). a student concludes that an increase in income causes an increase in health. Describe two problems with the student's Select all that apply. OA. The student has interpreted the data in the table incorrectly. B. The proportions for the sample may not equal the proportions for the population. C. Too few adults were chosen for the survey to give statistically significant results. D. The survey is an observational study, so causality cannot be assumed.
A total of 2462 American adults responded to a survey about their income class and their general health level. The table to the right summarizes their responses. Answer parts (a) through (e). Middle Income Income Class versus General Health Level Health in General Excellent Good Poor Total 203 424 144 771 Upper Income 225 57 582 274 1081 299 254 610 485 1305 672 2462 Lower Income Total a. What proportion of the lower-income adults have excellent health? (Type an integer or decimal rounded to three decimal places as needed.) b. What proportion of the middle-income adults have excellent health? (Type an integer or decimal rounded to three decimal places as needed.) c. What proportion of the upper-income adults have excellent health? Type an integer or decimal rounded to three decimal places as needed.) d. On the basis of finding the results for parts (a), (b), and (c). a student concludes that an increase in income causes an increase in health. Describe two problems with the student's Select all that apply. OA. The student has interpreted the data in the table incorrectly. B. The proportions for the sample may not equal the proportions for the population. C. Too few adults were chosen for the survey to give statistically significant results. D. The survey is an observational study, so causality cannot be assumed.

Algebra & Trigonometry with Analytic Geometry
13th Edition
ISBN:9781133382119
Author:Swokowski
Publisher:Swokowski
Chapter7: Analytic Trigonometry
Section7.2: Trigonometric Equations
Problem 100E

Related questions
Question
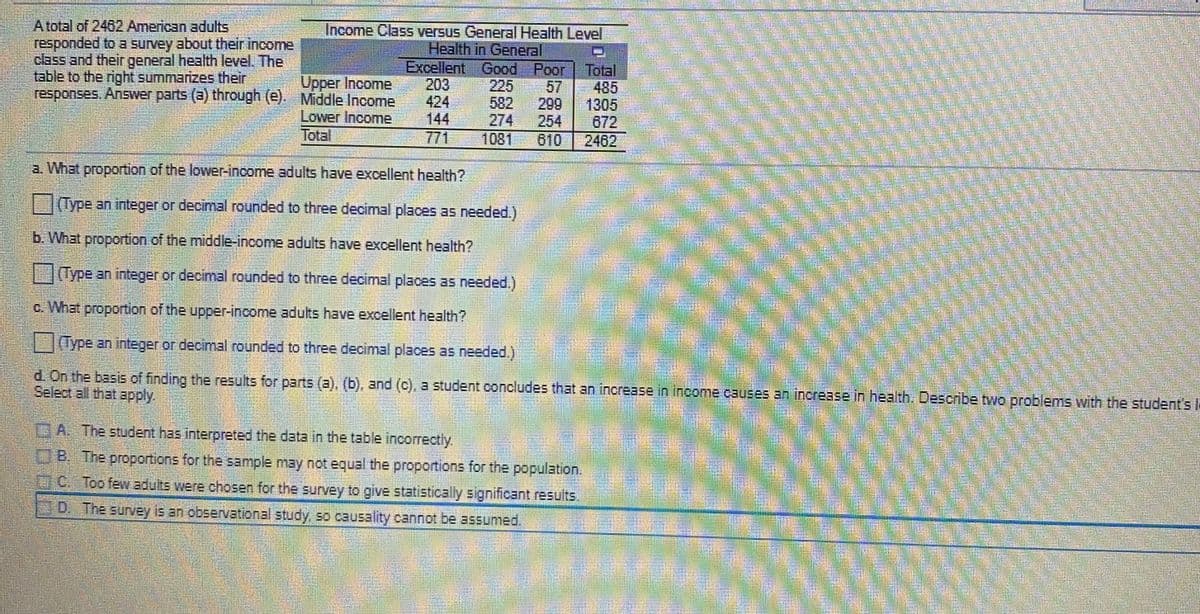
Transcribed Image Text:Atotal of 2462 American adults
responded to a survey about their income
class and their general health level. The
table to the right summarizes their
responses. Answer parts (a) through (e). Middle Income
Income Class versus General Health Level
Health in General
Excellent Good Poor
225
582
274
1081
Upper Income
Total
57
203
424
144
771
485
1305
672
2462
299
Lower Income
Total
254
610
a. What proportion of the lower-income adults have excellent health?
(Type an integer or decimal rounded to three decimal places as needed.)
b. What proportion of the middle-income adults have excellent health?
(Type an integer or decimal rounded to three decimal places as needed.)
c. What proportion of the upper-income adults have excellent health?
(Type an integer or decimal rounded to three decimal places as needed.)
d.On the basis of finding the results for parts (a). (b), and (c), a student concludes that an increase in inconme causes an inerease in health. Describe two problems with the student'sl-
Select all that apply,
A. The student has interpreted the data in the table incorrectly.
OB. The proportions for the sample may not equal the proportions for the population.
EIC. Too few adults were chosen for the survey to give statiistically significant results.
D, The survey is an observational study, so causality cannot be assumed,
Expert Solution
This question has been solved!
Explore an expertly crafted, step-by-step solution for a thorough understanding of key concepts.

This is a popular solution!

Trending now
This is a popular solution!

Step by step
Solved in 2 steps with 1 images

Knowledge Booster


Learn more about
Need a deep-dive on the concept behind this application? Look no further. Learn more about this topic, statistics and related others by exploring similar questions and additional content below.Recommended textbooks for you
Algebra & Trigonometry with Analytic Geometry
Algebra
ISBN:
9781133382119
Author:
Swokowski
Publisher:
Cengage
Algebra & Trigonometry with Analytic Geometry
Algebra
ISBN:
9781133382119
Author:
Swokowski
Publisher:
Cengage