a) Write down the estimated regression equation and interpret the estimated regression coefficients for X; and X,. b) Test if the overall regression model is significant or not using a 0.05 level of significance. c) Test the significance of each regression coefficient. Use significance level 0.05.
a) Write down the estimated regression equation and interpret the estimated regression coefficients for X; and X,. b) Test if the overall regression model is significant or not using a 0.05 level of significance. c) Test the significance of each regression coefficient. Use significance level 0.05.

College Algebra
7th Edition
ISBN:9781305115545
Author:James Stewart, Lothar Redlin, Saleem Watson
Publisher:James Stewart, Lothar Redlin, Saleem Watson
Chapter1: Equations And Graphs
Section: Chapter Questions
Problem 10T: Olympic Pole Vault The graph in Figure 7 indicates that in recent years the winning Olympic men’s...

Related questions
Topic Video
Question
Answer the following questions.
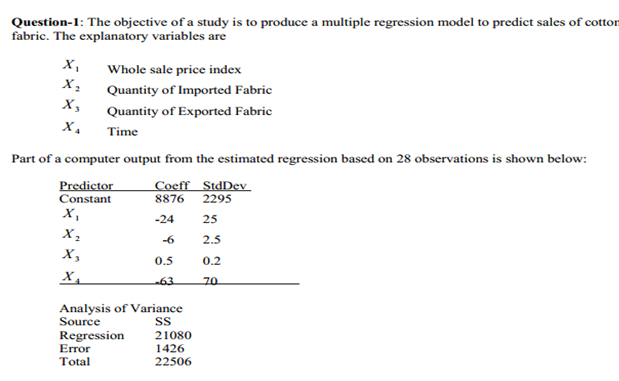
Transcribed Image Text:Question-1: The objective of a study is to produce a multiple regression model to predict sales of cotton
fabric. The explanatory variables are
X,
Whole sale price index
Quantity of Imported Fabric
х,
Quantity of Exported Fabric
Time
Part of a computer output from the estimated regression based on 28 observations is shown below:
Predictor
Constant
Coeff StdDev
8876
2295
X,
-24
25
-6
2.5
X,
0.5
0.2
X,
63
70
Analysis of Variance
Source
Regression
Error
Total
21080
1426
22506
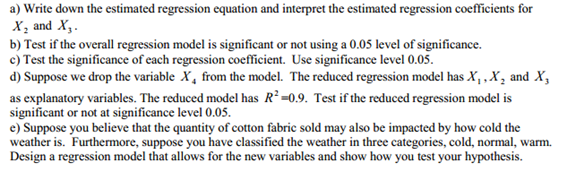
Transcribed Image Text:a) Write down the estimated regression equation and interpret the estimated regression coefficients for
X, and X,.
b) Test if the overall regression model is significant or not using a 0.05 level of significance.
c) Test the significance of each regression coefficient. Use significance level 0.05.
d) Suppose we drop the variable X, from the model. The reduced regression model has X,, X, and X,
as explanatory variables. The reduced model has R² =0.9. Test if the reduced regression model is
significant or not at significance level 0.05.
e) Suppose you believe that the quantity of cotton fabric sold may also be impacted by how cold the
weather is. Furthermore, suppose you have classified the weather in three categories, cold, normal, warm.
Design a regression model that allows for the new variables and show how you test your hypothesis.
Expert Solution
This question has been solved!
Explore an expertly crafted, step-by-step solution for a thorough understanding of key concepts.

Step by step
Solved in 4 steps with 3 images

Knowledge Booster


Learn more about
Need a deep-dive on the concept behind this application? Look no further. Learn more about this topic, statistics and related others by exploring similar questions and additional content below.Recommended textbooks for you
College Algebra
Algebra
ISBN:
9781305115545
Author:
James Stewart, Lothar Redlin, Saleem Watson
Publisher:
Cengage Learning
College Algebra
Algebra
ISBN:
9781305115545
Author:
James Stewart, Lothar Redlin, Saleem Watson
Publisher:
Cengage Learning