a. Use the table below to graph & label a Production Possibilities curve on the grid below Popcorn or Cotton Candy Popcorn Cotton Candy Popcorn 10 1 9. 7 3 4 4 Cotton Cand b. Next, label a point of underutilization (inefficiency). Call it Point A, Next, label apoint of efficiency. Call it Point B. Last, label a point that is now unattainable. Call it Point C. C. Look at the table: To get one popcorn stand, how many cotton candy stands have to be given up (marginal/opportunity cost)? 10-9 = ?
a. Use the table below to graph & label a Production Possibilities curve on the grid below Popcorn or Cotton Candy Popcorn Cotton Candy Popcorn 10 1 9. 7 3 4 4 Cotton Cand b. Next, label a point of underutilization (inefficiency). Call it Point A, Next, label apoint of efficiency. Call it Point B. Last, label a point that is now unattainable. Call it Point C. C. Look at the table: To get one popcorn stand, how many cotton candy stands have to be given up (marginal/opportunity cost)? 10-9 = ?

Principles of Microeconomics
7th Edition
ISBN:9781305156050
Author:N. Gregory Mankiw
Publisher:N. Gregory Mankiw
Chapter22: Frontiers Of Microeconomics
Section: Chapter Questions
Problem 6PA

Related questions
Question
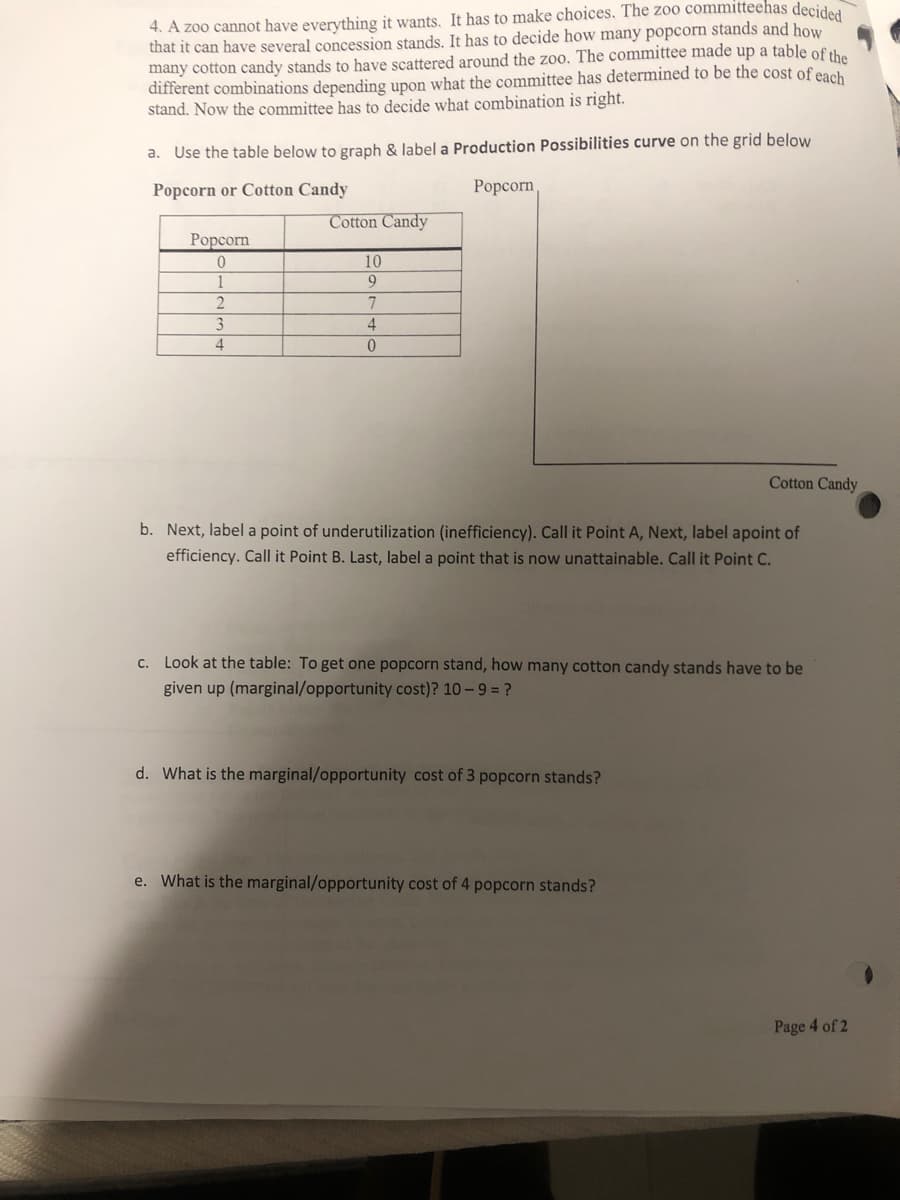
Transcribed Image Text:4. A zoo cannot have everything it wants. It has to make choices. The zoo committeehas decidea
that it can have several concession stands. It has to decide how many popcorn stands and how
many cotton candy stands to have scattered around the zoo, The committee made up a table of the
different combinations depending upon what the committee has determined to be the cost of each
stand. Now the committee has to decide what combination is right.
a. Use the table below to graph & label a Production Possibilities curve on the grid below
Popcorn or Cotton Candy
Popcorn,
Cotton Candy
Popcorn
10
1
9
2.
4
4
Cotton Candy
b. Next, label a point of underutilization (inefficiency). Call it Point A, Next, label apoint of
efficiency. Call it Point B. Last, label a point that is now unattainable. Call it Point C.
c. Look at the table: To get one popcorn stand, how many cotton candy stands have to be
given up (marginal/opportunity cost)? 10 -9 = ?
d. What is the marginal/opportunity cost of 3 popcorn stands?
e. What is the marginal/opportunity cost of 4 popcorn stands?
Page 4 of 2
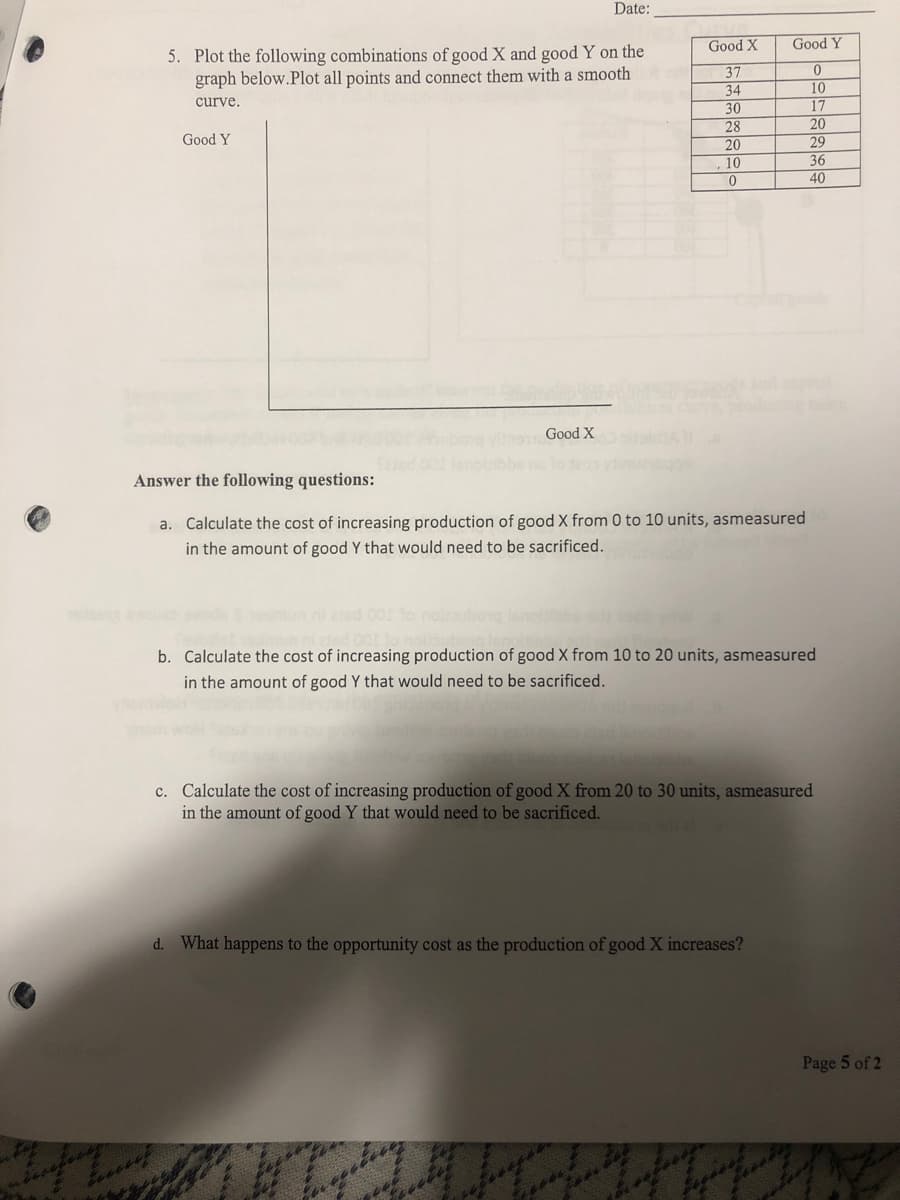
Transcribed Image Text:Date:
Good X
Good Y
5. Plot the following combinations of good X and good Y on the
graph below.Plot all points and connect them with a smooth
37
34
30
28
20
10
10
17
20
29
curve.
Good Y
36
40
oducto ce
Good X
Answer the following questions:
a. Calculate the cost of increasing production of good X from 0 to 10 units, asmeasured
in the amount of good Y that would need to be sacrificed.
b. Calculate the cost of increasing production of good X from 10 to 20 units, asmeasured
in the amount of good Y that would need to be sacrificed.
c. Calculate the cost of increasing production of good X from 20 to 30 units, asmeasured
in the amount of good Y that would need to be sacrificed.
d. What happens to the opportunity cost as the production of good X increases?
Page 5 of 2
Expert Solution
This question has been solved!
Explore an expertly crafted, step-by-step solution for a thorough understanding of key concepts.

This is a popular solution!

Trending now
This is a popular solution!

Step by step
Solved in 2 steps with 3 images

Follow-up Questions
Read through expert solutions to related follow-up questions below.
Follow-up Question
How do you find the marginal costs (questions d and e)
Solution
Recommended textbooks for you
Principles of Microeconomics
Economics
ISBN:
9781305156050
Author:
N. Gregory Mankiw
Publisher:
Cengage Learning

Principles of Economics, 7th Edition (MindTap Cou…
Economics
ISBN:
9781285165875
Author:
N. Gregory Mankiw
Publisher:
Cengage Learning

Principles of Microeconomics (MindTap Course List)
Economics
ISBN:
9781305971493
Author:
N. Gregory Mankiw
Publisher:
Cengage Learning
Principles of Microeconomics
Economics
ISBN:
9781305156050
Author:
N. Gregory Mankiw
Publisher:
Cengage Learning
Principles of Economics, 7th Edition (MindTap Cou…
Economics
ISBN:
9781285165875
Author:
N. Gregory Mankiw
Publisher:
Cengage Learning
Principles of Microeconomics (MindTap Course List)
Economics
ISBN:
9781305971493
Author:
N. Gregory Mankiw
Publisher:
Cengage Learning

Principles of Economics (MindTap Course List)
Economics
ISBN:
9781305585126
Author:
N. Gregory Mankiw
Publisher:
Cengage Learning

Essentials of Economics (MindTap Course List)
Economics
ISBN:
9781337091992
Author:
N. Gregory Mankiw
Publisher:
Cengage Learning

Principles of Economics 2e
Economics
ISBN:
9781947172364
Author:
Steven A. Greenlaw; David Shapiro
Publisher:
OpenStax