a.Compute the 2017 return on assets (ROA) for both companies. b.Disaggregate ROA into profit margin (PM) and asset turnover (AT) for each company. Confirm that ROA = PM x AT. c.Discuss differences observed with respect to PM and AT and interpret these differences in light of each company’s business model.
a.Compute the 2017 return on assets (ROA) for both companies. b.Disaggregate ROA into profit margin (PM) and asset turnover (AT) for each company. Confirm that ROA = PM x AT. c.Discuss differences observed with respect to PM and AT and interpret these differences in light of each company’s business model.

Cornerstones of Financial Accounting
4th Edition
ISBN:9781337690881
Author:Jay Rich, Jeff Jones
Publisher:Jay Rich, Jeff Jones
Chapter12: Fainancial Statement Analysis
Section: Chapter Questions
Problem 59BE

Related questions
Question
a.Compute the 2017 return on assets (ROA) for both companies.
b.Disaggregate ROA into profit margin (PM) and asset turnover (AT) for each company. Confirm that ROA = PM x AT.
c.Discuss differences observed with respect to PM and AT and interpret these differences in light of each company’s business model.
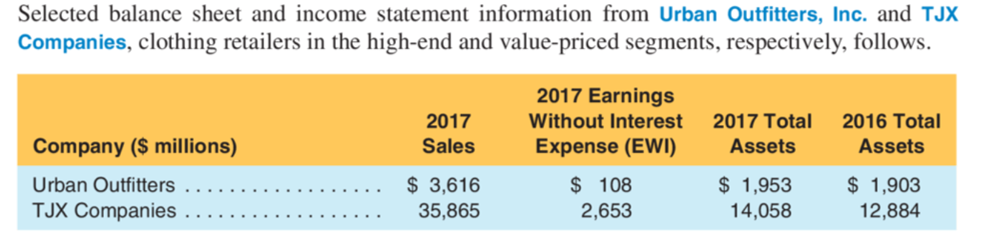
Transcribed Image Text:Selected balance sheet and income statement information from Urban Outfitters, Inc. and TJX
Companies, clothing retailers in the high-end and value-priced segments, respectively, follows.
2017 Earnings
2017
Without Interest
2017 Total
2016 Total
Company ($ millions)
Sales
Expense (EWI)
Assets
Assets
$ 108
2,653
$ 1,903
$ 3,616
35,865
$ 1,953
14,058
Urban Outfitters
TJX Companies
12,884
Expert Solution
This question has been solved!
Explore an expertly crafted, step-by-step solution for a thorough understanding of key concepts.

This is a popular solution!

Trending now
This is a popular solution!

Step by step
Solved in 3 steps with 2 images

Knowledge Booster


Learn more about
Need a deep-dive on the concept behind this application? Look no further. Learn more about this topic, accounting and related others by exploring similar questions and additional content below.Recommended textbooks for you
Cornerstones of Financial Accounting
Accounting
ISBN:
9781337690881
Author:
Jay Rich, Jeff Jones
Publisher:
Cengage Learning


Financial Accounting: The Impact on Decision Make…
Accounting
ISBN:
9781305654174
Author:
Gary A. Porter, Curtis L. Norton
Publisher:
Cengage Learning
Cornerstones of Financial Accounting
Accounting
ISBN:
9781337690881
Author:
Jay Rich, Jeff Jones
Publisher:
Cengage Learning
Financial Accounting: The Impact on Decision Make…
Accounting
ISBN:
9781305654174
Author:
Gary A. Porter, Curtis L. Norton
Publisher:
Cengage Learning