Using average value, calculate TWO (2) relevant financial ratios for each of the following areas that are useful in determining the overall performance of the company for 2019 and 2018.
Using average value, calculate TWO (2) relevant financial ratios for each of the following areas that are useful in determining the overall performance of the company for 2019 and 2018.

Cornerstones of Financial Accounting
4th Edition
ISBN:9781337690881
Author:Jay Rich, Jeff Jones
Publisher:Jay Rich, Jeff Jones
Chapter9: Long-term Liabilities
Section: Chapter Questions
Problem 89E: Ratio Analysis Rising Stars Academy provided the following information on its 2019 balance sheet and...

Related questions
Question
- Using average value, calculate TWO (2) relevant financial ratios for each of the following areas that are useful in determining the overall performance of the company for 2019 and 2018.
- Ability to meet short term maturing financial obligations.
- Effectiveness in managing assets and efficiency in handling operations
- Profitability and overall operating results
- Ability to service debt and the degree of financial risk
ROE using the DuPont Method
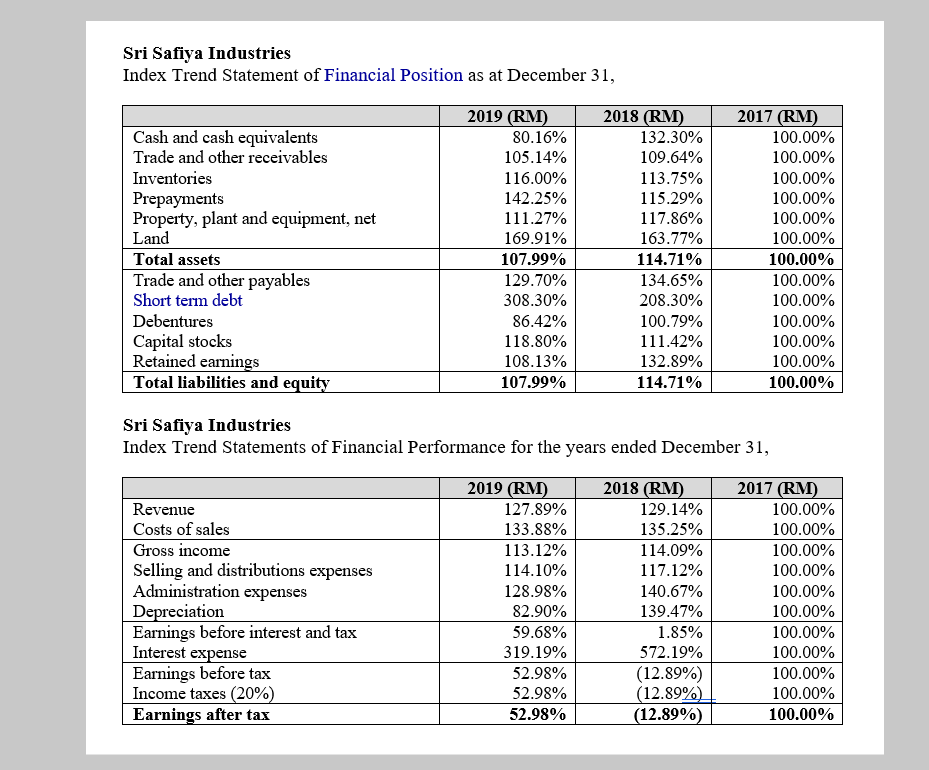
Transcribed Image Text:Sri Safiya Industries
Index Trend Statement of Financial Position as at December 31,
2018 (RM)
132.30%
2017 (RM)
100.00%
100.00%
2019 (RM)
Cash and cash equivalents
80.16%
Trade and other receivables
105.14%
109.64%
Inventories
116.00%
113.75%
100.00%
Prepayments
Property, plant and equipment, net
Land
Total assets
Trade and other payables
Short term debt
142.25%
115.29%
100.00%
111.27%
117.86%
100.00%
169.91%
163.77%
100.00%
107.99%
114.71%
100.00%
129.70%
134.65%
100.00%
308.30%
208.30%
100.00%
Debentures
Capital stocks
Retained earnings
Total liabilities and equity
86.42%
100.79%
100.00%
118.80%
111.42%
100.00%
108.13%
132.89%
100.00%
107.99%
114.71%
100.00%
Sri Safiya Industries
Index Trend Statements of Financial Performance for the years ended December 31,
2019 (RM)
127.89%
2018 (RM)
2017 (RM)
Revenue
129.14%
100.00%
Costs of sales
133.88%
135.25%
100.00%
Gross income
Selling and distributions expenses
Administration expenses
Depreciation
Earnings before interest and tax
Interest expense
Earnings before tax
Income taxes (20%)
Earnings after tax
113.12%
114.09%
100.00%
114.10%
117.12%
100.00%
128.98%
140.67%
100.00%
82.90%
139.47%
100.00%
59.68%
1.85%
100.00%
319.19%
572.19%
100.00%
100.00%
(12.89%)
(12.89%)
(12.89%)
52.98%
52.98%
100.00%
52.98%
100.00%
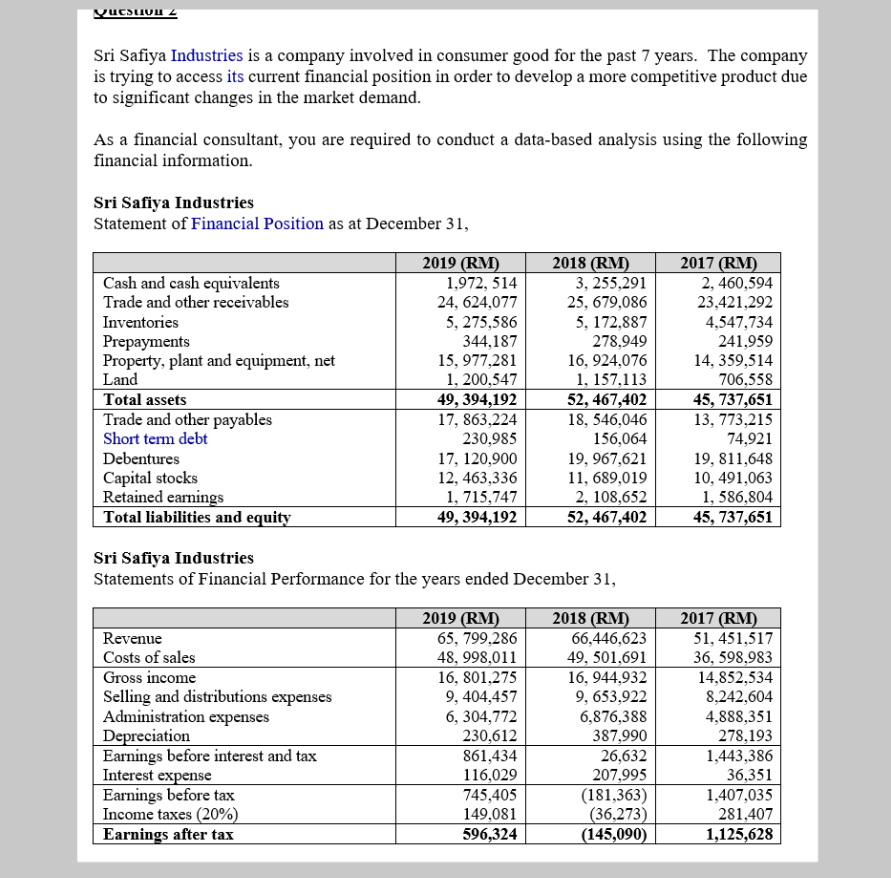
Transcribed Image Text:Sri Safiya Industries is a company involved in consumer good for the past 7 years. The company
is trying to access its current financial position in order to develop a more competitive product due
to significant changes in the market demand.
As a financial consultant, you are required to conduct a data-based analysis using the following
financial information.
Sri Safiya Industries
Statement of Financial Position as at December 31,
2019 (RM)
1,972, 514
24, 624,077
2018 (RM)
2017 (RM)
Cash and cash equivalents
Trade and other receivables
3, 255,291
25, 679,086
2, 460,594
23,421,292
5, 275,586
344,187
15, 977,281
1, 200,547
49, 394,192
17, 863,224
230,985
17, 120,900
12, 463,336
1, 715,747
49, 394,192
Inventories
5, 172,887
278,949
16, 924,076
1, 157,113
52, 467,402
18, 546,046
156,064
19, 967,621
11, 689,019
2, 108,652
4,547,734
Prepayments
Property, plant and equipment, net
Land
241,959
14, 359,514
706,558
45, 737,651
Total assets
Trade and other payables
Short term debt
13, 773,215
74,921
19, 811,648
10, 491,063
1, 586,804
45, 737,651
Debentures
Capital stocks
Retained earnings
Total liabilities and equity
52, 467,402
Sri Safiya Industries
Statements of Financial Performance for the years ended December 31,
2019 (RM)
65, 799,286
Revenue
Costs of sales
Gross income
Selling and distributions expenses
Administration expenses
Depreciation
Earnings before interest and tax
Interest expense
Earnings before tax
Income taxes (20%)
Earnings after tax
2018 (RM)
66,446,623
49, 501,691
16, 944,932
9, 653,922
6,876,388
387,990
26,632
207,995
(181,363)
(36,273)
(145,090)
2017 (RM)
51, 451,517
36, 598,983
14,852,534
8,242,604
4,888,351
278,193
1,443,386
36,351
48, 998,011
16, 801,275
9, 404,457
6, 304,772
230,612
861,434
116,029
745,405
149,081
596,324
1,407,035
281,407
1,125,628
Expert Solution
This question has been solved!
Explore an expertly crafted, step-by-step solution for a thorough understanding of key concepts.

Step by step
Solved in 3 steps with 4 images

Knowledge Booster


Learn more about
Need a deep-dive on the concept behind this application? Look no further. Learn more about this topic, finance and related others by exploring similar questions and additional content below.Recommended textbooks for you
Cornerstones of Financial Accounting
Accounting
ISBN:
9781337690881
Author:
Jay Rich, Jeff Jones
Publisher:
Cengage Learning

Financial Accounting: The Impact on Decision Make…
Accounting
ISBN:
9781305654174
Author:
Gary A. Porter, Curtis L. Norton
Publisher:
Cengage Learning

Cornerstones of Financial Accounting
Accounting
ISBN:
9781337690881
Author:
Jay Rich, Jeff Jones
Publisher:
Cengage Learning
Financial Accounting: The Impact on Decision Make…
Accounting
ISBN:
9781305654174
Author:
Gary A. Porter, Curtis L. Norton
Publisher:
Cengage Learning

Survey of Accounting (Accounting I)
Accounting
ISBN:
9781305961883
Author:
Carl Warren
Publisher:
Cengage Learning

Financial & Managerial Accounting
Accounting
ISBN:
9781285866307
Author:
Carl Warren, James M. Reeve, Jonathan Duchac
Publisher:
Cengage Learning

Fundamentals Of Financial Management, Concise Edi…
Finance
ISBN:
9781337902571
Author:
Eugene F. Brigham, Joel F. Houston
Publisher:
Cengage Learning