(A)Prepare ratio analyses (for 2019, 2018, and 2017) for both companies.You should include the following ratios in your computations: 1. Profitability ratios Gross Profit margin Profit margin Return on assets Return on equity
(A)Prepare ratio analyses (for 2019, 2018, and 2017) for both companies.You should include the following ratios in your computations: 1. Profitability ratios Gross Profit margin Profit margin Return on assets Return on equity

Chapter1: Financial Statements And Business Decisions
Section: Chapter Questions
Problem 1Q

Related questions
Question
(A)Prepare ratio analyses (for 2019, 2018, and 2017) for both companies.You should include the following ratios in your computations:
1. Profitability ratios
Gross Profit margin
Profit margin
Return on assets
Return on equity
2. Productivity
Inventory Turnover
PPE Turnover
Asset Turnover
3. Solvency
Debt-to-equity
Times interest earned
Return on Financial leverage
4.
Current Ratio
Quick Ratio
Operating cash flow to current liabilities
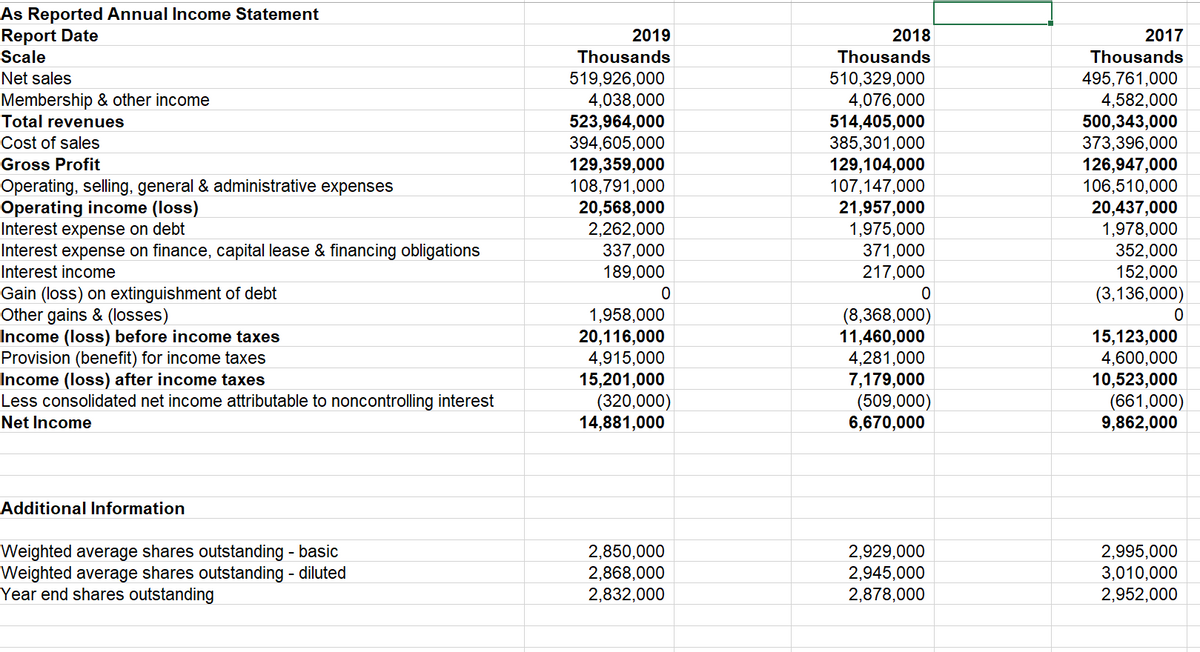
Transcribed Image Text:As Reported Annual Income Statement
Report Date
Scale
2019
2018
2017
Thousands
Thousands
Thousands
519,926,000
4,038,000
523,964,000
394,605,000
129,359,000
108,791,000
20,568,000
2,262,000
337,000
189,000
495,761,000
4,582,000
500,343,000
373,396,000
126,947,000
106,510,000
20,437,000
1,978,000
352,000
152,000
(3,136,000)
Net sales
510,329,000
4,076,000
514,405,000
385,301,000
129,104,000
107,147,000
21,957,000
1,975,000
371,000
217,000
Membership & other income
Total revenues
Cost of sales
Gross Profit
Operating, selling, general & administrative expenses
Operating income (loss)
Interest expense on debt
Interest expense on finance, capital lease & financing obligations
Interest income
Gain (loss) on extinguishment of debt
Other gains & (losses)
Income (loss) before income taxes
Provision (benefit) for income taxes
Income (loss) after income taxes
Less consolidated net income attributable to noncontrolling interest
1,958,000
20,116,000
4,915,000
15,201,000
(320,000)
14,881,000
(8,368,000)
11,460,000
4,281,000
7,179,000
(509,000)
6,670,000
15,123,000
4,600,000
10,523,000
(661,000)
9,862,000
Net Income
Additional Information
Weighted average shares outstanding - basic
Weighted average shares outstanding - diluted
Year end shares outstanding
2,850,000
2,868,000
2,832,000
2,929,000
2,945,000
2,878,000
2,995,000
3,010,000
2,952,000
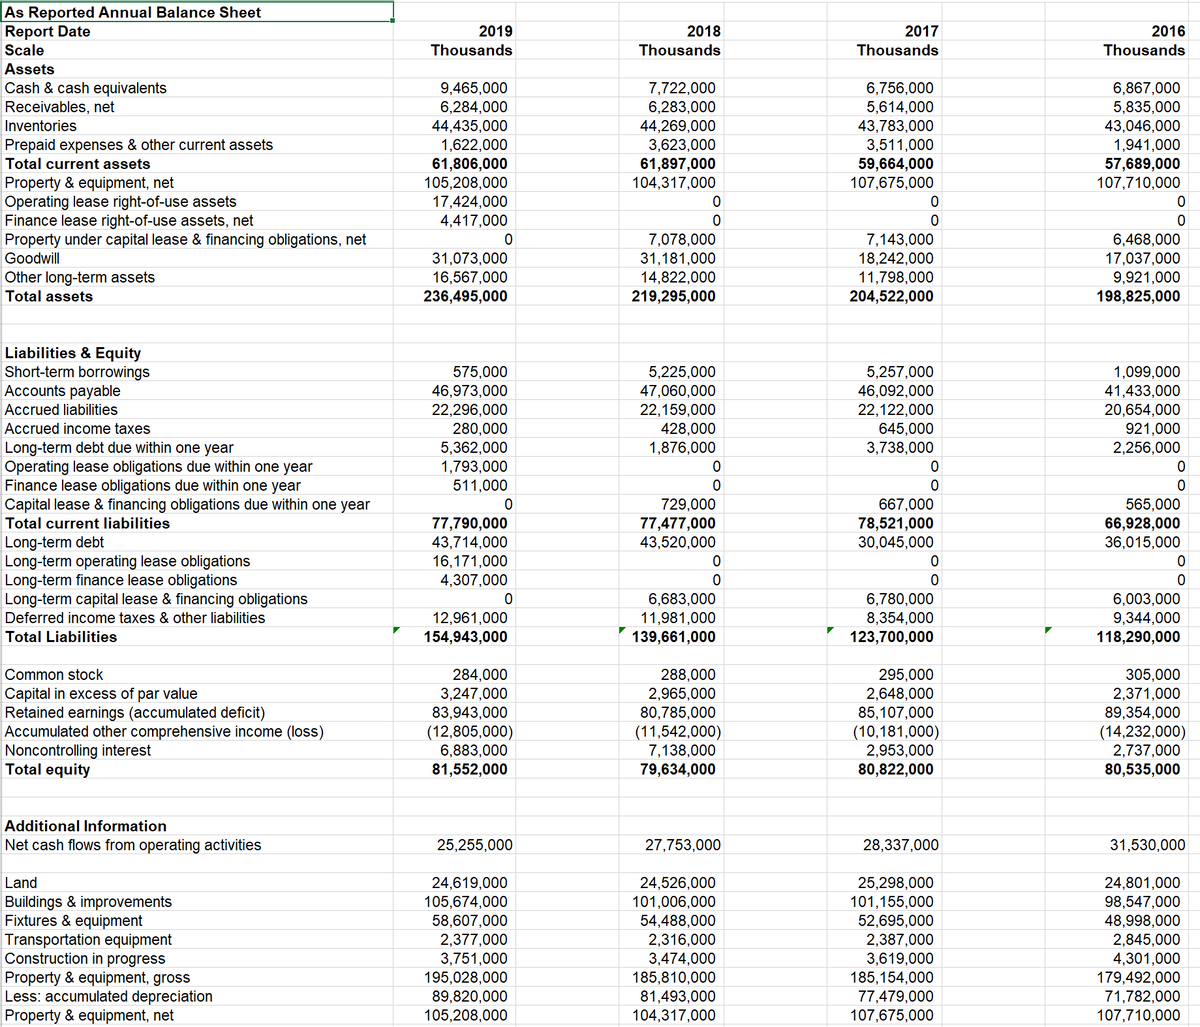
Transcribed Image Text:As Reported Annual Balance Sheet
Report Date
Scale
2019
2018
2017
2016
Thousands
Thousands
Thousands
Thousands
Assets
Cash & cash equivalents
9,465,000
6,284,000
44,435,000
1,622,000
61,806,000
105,208,000
17,424,000
4,417,000
7,722,000
6,283,000
44,269,000
3,623,000
61,897,000
104,317,000
6,756,000
5,614,000
43,783,000
3,511,000
59,664,000
107,675,000
6,867,000
5,835,000
43,046,000
1,941,000
57,689,000
107,710,000
Receivables, net
Inventories
Prepaid expenses & other current assets
Total current assets
Property & equipment, net
Operating lease right-of-use assets
Finance lease right-of-use assets, net
Property under capital lease & financing obligations, net
7,078,000
31,181,000
7,143,000
18,242,000
11,798,000
204,522,000
6,468,000
17,037,000
9,921,000
198,825,000
Goodwill
Other long-term assets
Total assets
31,073,000
16,567,000
236,495,000
14,822,000
219,295,000
Liabilities & Equity
Short-term borrowings
Accounts payable
575,000
46,973,000
22,296,000
280,000
5,362,000
1,793,000
511,000
5,225,000
47,060,000
22,159,000
428,000
1,876,000
5,257,000
46,092,000
22,122,000
645,000
3,738,000
1,099,000
41,433,000
20,654,000
921,000
Accrued liabilities
Accrued income taxes
Long-term debt due within one year
Operating lease obligations due within one year
Finance lease obligations due within one year
Capital lease & financing obligations due within one year
2,256,000
729,000
77,477,000
43,520,000
667,000
78,521,000
30,045,000
565,000
66,928,000
36,015,000
Total current liabilities
Long-term debt
Long-term operating lease obligations
Long-term finance lease obligations
Long-term capital lease & financing obligations
77,790,000
43,714,000
16,171,000
4,307,000
6,683,000
11,981,000
139,661,000
6,780,000
8,354,000
123,700,000
6,003,000
9,344,000
118,290,000
Deferred income taxes & other liabilities
12,961,000
154,943,000
Total Liabilities
Common stock
|Capital in excess of par value
Retained earnings (accumulated deficit)
Accumulated other comprehensive income (loss)
Noncontrolling interest
Total equity
284,000
3,247,000
83,943,000
(12,805,000)
6,883,000
81,552,000
288,000
2,965,000
80,785,000
(11,542,000)
7,138,000
79,634,000
295,000
2,648,000
85,107,000
(10,181,000)
2,953,000
80,822,000
305,000
2,371,000
89,354,000
(14,232,000)
2,737,000
80,535,000
Additional Information
Net cash flows from operating activities
25,255,000
27,753,000
28,337,000
31,530,000
24,526,000
101,006,000
54,488,000
2,316,000
3,474,000
185,810,000
81,493,000
104,317,000
24,801,000
98,547,000
48,998,000
2,845,000
4,301,000
179,492,000
71,782,000
107,710,000
Land
Buildings & improvements
Fixtures & equipment
Transportation equipment
Construction in progress
Property & equipment, gross
Less: accumulated depreciation
Property & equipment, net
24,619,000
105,674,000
58,607,000
2,377,000
3,751,000
195,028,000
89,820,000
105,208,000
25,298,000
101,155,000
52,695,000
2,387,000
3,619,000
185,154,000
77,479,000
107,675,000
Expert Solution
This question has been solved!
Explore an expertly crafted, step-by-step solution for a thorough understanding of key concepts.

This is a popular solution!

Trending now
This is a popular solution!

Step by step
Solved in 4 steps with 4 images

Knowledge Booster


Learn more about
Need a deep-dive on the concept behind this application? Look no further. Learn more about this topic, accounting and related others by exploring similar questions and additional content below.Recommended textbooks for you

Accounting
Accounting
ISBN:
9781337272094
Author:
WARREN, Carl S., Reeve, James M., Duchac, Jonathan E.
Publisher:
Cengage Learning,

Accounting Information Systems
Accounting
ISBN:
9781337619202
Author:
Hall, James A.
Publisher:
Cengage Learning,
Accounting
Accounting
ISBN:
9781337272094
Author:
WARREN, Carl S., Reeve, James M., Duchac, Jonathan E.
Publisher:
Cengage Learning,
Accounting Information Systems
Accounting
ISBN:
9781337619202
Author:
Hall, James A.
Publisher:
Cengage Learning,

Horngren's Cost Accounting: A Managerial Emphasis…
Accounting
ISBN:
9780134475585
Author:
Srikant M. Datar, Madhav V. Rajan
Publisher:
PEARSON

Intermediate Accounting
Accounting
ISBN:
9781259722660
Author:
J. David Spiceland, Mark W. Nelson, Wayne M Thomas
Publisher:
McGraw-Hill Education

Financial and Managerial Accounting
Accounting
ISBN:
9781259726705
Author:
John J Wild, Ken W. Shaw, Barbara Chiappetta Fundamental Accounting Principles
Publisher:
McGraw-Hill Education