Analyte X absorbs at region 300 – 450 nm while Titrant absorbs at region 400 – 550 nm and product absorbs at region 650 – 750 nm. What would be the expected photometric titration curve at 500 nm? A A A A Vol titrant Vol titrant Figure D Vol titrant Vol titrant Figure A Figure B Figure C O Figure B O Figure A O Figure C O Figure D
Analyte X absorbs at region 300 – 450 nm while Titrant absorbs at region 400 – 550 nm and product absorbs at region 650 – 750 nm. What would be the expected photometric titration curve at 500 nm? A A A A Vol titrant Vol titrant Figure D Vol titrant Vol titrant Figure A Figure B Figure C O Figure B O Figure A O Figure C O Figure D

Chapter12: Spectrochemical Methods
Section: Chapter Questions
Problem 15P

Related questions

Question
no need for detailed answer. a brief explanation would do
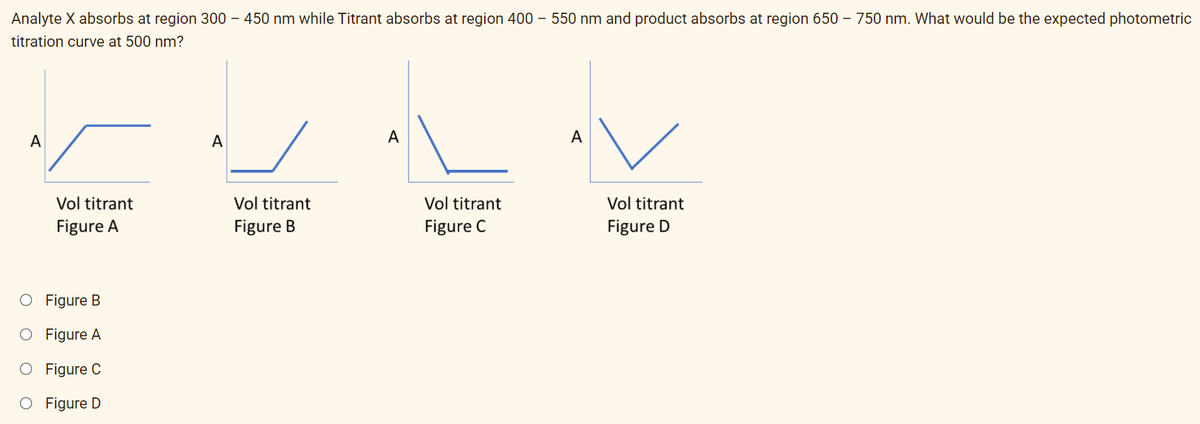
Transcribed Image Text:Analyte X absorbs at region 300 – 450 nm while Titrant absorbs at region 400 – 550 nm and product absorbs at region 650 – 750 nm. What would be the expected photometric
titration curve at 500 nm?
A
A
А
A
Vol titrant
Vol titrant
Vol titrant
Vol titrant
Figure A
Figure B
Figure C
Figure D
O Figure B
O Figure A
O Figure C
O Figure D
Expert Solution
This question has been solved!
Explore an expertly crafted, step-by-step solution for a thorough understanding of key concepts.

This is a popular solution!

Trending now
This is a popular solution!

Step by step
Solved in 3 steps with 3 images

Knowledge Booster


Learn more about
Need a deep-dive on the concept behind this application? Look no further. Learn more about this topic, chemistry and related others by exploring similar questions and additional content below.Recommended textbooks for you

Principles of Instrumental Analysis
Chemistry
ISBN:
9781305577213
Author:
Douglas A. Skoog, F. James Holler, Stanley R. Crouch
Publisher:
Cengage Learning
Principles of Instrumental Analysis
Chemistry
ISBN:
9781305577213
Author:
Douglas A. Skoog, F. James Holler, Stanley R. Crouch
Publisher:
Cengage Learning