Apples and Nuts Company Balance Sheets December 31, 2012 December 31, 2011 Current assets: Cash Accounts receivable, net Inventory Prepaid rent Total current assets Equipment, net Total assets $ 98,000 310,000 275,000 10,000 693,000 180,000 $873,000 $ 90,000 216,000 170,000 6,000 482,000 258,000 $740,000 .... Total current liabilities Long-term liabilities Total liabilities Common stockholders' equity Retained earnings Total liabilities and stockholders' equity. $206,000 219.000 425,000 250,000 $223,000 217,000 440,000 190,000 110,000 $740,000 198,000 $873,000 Net income for the year ended December 31, 2012, was $100,000. Requirements 1. Compute as many of the financial statement ratios you have studied as possible with the information from Apples and Nuts Company. (Compute 2012 ratios.) 2. Would you invest in this company? Why or why not? What additional information would be helpful in making this decision?
Q: Balance Sheet At December 31, 2012 Assets Liabilities and Equity $ 72 $60 Cash Accounts Receivable…
A: The question is based on the concept of accounting ratios. As per Bartleby guidelines we are allowed…
Q: 94: The following comparable balance sheet for Ibrahim Stores for the year ended Dec.31, 2012:…
A: Introduction An income statement is the financial statement that reveals income and expenditure of…
Q: Balance Sheet Cole Eagan Enterprises December 31, 2013 $4,500 Cash Accounts Payable Notes Payable…
A:
Q: Test Company (S millions) Income Statement Revenues Cost of Goods Sold Operating Income Interest…
A: Since we only answer up to 3 sub-parts, we’ll answer the first 3. Please resubmit the question and…
Q: Simon Company’s year-end balance sheets follow. At December 31 2017 2016 2015 Assets…
A: Inventory turnover can be defined as the efficiency ratio ratio that determine how many times a…
Q: Win's Companies Balance Sheet May 31, 2018 and 2017 Assets Liabilities 2018 2017 2018 2017 Cash %24…
A: Current ratio: The financial ratio which evaluates the ability of a company to pay off the debt…
Q: SCANDI HOME FURNISHINGS, INC. BALANCE SHEETS 2011 2012 2013 Cash $ 50,000 $ 40,000 $ 10,000 Accounts…
A: The question is based on the concept of calculation of different ratios from financial statement of…
Q: 1. The following information is provided in the 2018 annual report to shareholders of The BizStore:…
A: The balance sheet represents the financial position of the company that includes assets,…
Q: Using ratios to reconstruct a balance sheet Traditional Mills’s balance sheet appears as Follows…
A: Compute the missing amounts.
Q: December 31, December 31, 2015 2016 Cash $700 $1,130 Accounts receivable 450 310 Inventory 350 400…
A: The cash flow statement is prepared to record the cash flow from various activities during the…
Q: MARIN COMPANY Comparative Balance Sheets December 31 Assets 2010 2009 $ 41,000 $ 57,000 64,000 Cash…
A: Cash flow statement is a statement which is prepared to find out the cash comes in and goes out , by…
Q: Jinchuriki Inc.'s Financial Statement for years 2014-2015. Compute of the Average Collection Period.…
A: Average collection period: It implies to a financial measure that shows a total amount of time it…
Q: Prepare an income statement for China Tea Company for the year ended December 31, 2018. Debit 10,900…
A: Formula: Net Income = Revenues - Expenses
Q: Use the following excerpts from Mountain Company’s financial information to prepare astatement of…
A: Statement of cash flows is one of the financial statement of business, which shows all cash inflows…
Q: VERNET COMPANY Comparative Balance Sheets December 31 Assets 2012 2011 Cash $ 41,000 $ 57,000…
A: Given Particulars 2012 2011 Assets Cash…
Q: Balance Sheet. Dec 31' 2014 Dec 31' 2013 Dec 31' 2012 Cash And Cash Equivalents 768'000 860'000…
A: Financial ratio Financial ratios are helpful in the analysis of financial statements. It is also…
Q: Preparing the direct method statement of cash flows Red Toy Company reported the following…
A: 1. Collections from customers during 2018 = Beginning accounts receivables + Net sales revenue -…
Q: Instructions Prepare a statement of cash fl ows using the indirect method
A: Net increase in the cash must be equal to the net cash flow generated by operating, investing and…
Q: FOX COMPANY Balance Sheets Dec. 31, 2017 Dec. 31, 2016 Assets Cash $ 22,000 $ 10,000 Accounts…
A: Cash flow from Financing activities: It include transactions relating to the debt, equity, and…
Q: Declan's Designs Balance Sheet Declan's Designs Income Statement ASSETS 12/31/2021 12/31/2022 For…
A: Interest payable is a current liability. Increase or decrease in current liabilities affect the…
Q: ,000 Equipment 250,000 205,000 Accumulated depreciation—buildings (49,500) (40,000) $590,400…
A: A Cash Flow Statement is a part of the Financial Statement of a company. It literally means a…
Q: Sando Company Statements of Financial Position December 31,2012 and 2011 2012 Assets Cash $ 43,000…
A: The current ratio is calculated by dividing the sum of all current assets by all the current…
Q: Harbinger Corporation reports the following balances: As of 12/31/19 As of 12/31/20 Accounts…
A: Sales: Sales include a number of goods and services sold by the organization during their accounting…
Q: 2018 2017 Cash P 39,000 P 13,000 Accounts Receivable 46,000 61,000 Merchandise Inventory 94,000…
A: Statement of Cash Flows: Statement of Cash Flow is one of the main four financial statements,…
Q: Constructing Financial Statements from Account Data Barth Company reports the following year-end…
A: Lets understand the basis. Income statement is prepared to understand the revenue, expense and net…
Q: The following are the ledgers of XYZ Company for the year ended December 31, 2017. Net Sales…
A: Financial Ratio are one of the tool to Analysis Financial Statement. Income Statement of XYZ Company…
Q: Partial Balance Sheets as of December 31 Assets Cash Accounts receivable 2016 $20,000 90,000 20,000…
A: Ensign Company's Cash received from customer for 2016 is computed below : Cash received from…
Q: Following is the Balance Sheet of a concern on 31st March, 2015 : $ 10,00,000 Fixed Assets 1,40,000…
A:
Q: Simon Company's year-end balance sheets follow. At December 31 2017 2016 2015 Assets $ 25,796 $…
A: Days Sales Uncollected: The days' sales uncollected ratio is a liquidity measure that creditors and…
Q: SHARPE COMPANY COMPARATIVE STATEMENT OF FINANCIAL POSITION ACCOUNTS AS OF DECEMBER 31 Debit Balances…
A: The balance sheet represents the financial position of the business on a particular date.
Q: Simon Company's year-end balance sheets follow. At December 31 2017 2016 2015 Assets $ 30,510 $…
A: The current ratio is the measure of a company's ability to pay back its short-term debts. It is…
Q: XYZ Company, Balance Sheet for 12/31/2012 and 12/31/2013. 2012 2013 Cash $15,000 $14,000 Marketable…
A: Cash flow statement is the summary showing cash receipts and payments using indirect or direct…
Q: Balance Sheet Cole Eagan Enterprises December 31, 2013 $4,500 Cash Accounts Payable Notes Payable…
A: Formula to be used as follows:
Q: Vockery Market Co. Balance Sheet 2018 2017 Cash 20,000 24,000 ST Investments…
A: Ratio analysis means where different ratio of various years of years companies has been compared and…
Q: Liberty Corporation reported the following figures: Account 2016 2015 Cash and cash equivalents $ 2…
A: Vertical analysis of Balance sheet , shows all the assets as a percentage of total assets =…
Q: Simon Company's year-end balance sheets follow. At December 31 Current Yr 1 Yr Ago 2 Yrs Ago Assets…
A: Debt to equity ratio = Total liabilities / Total equity where, Total liabilities = Accounts payable…
Q: (1) Debt and equity ratios. Debt Ratio Choose Numerator: Choose Denominator: Debt Ratio Total…
A: 1) Debt and Equity Ratio Debt ratio…
Q: December 31. 2017 2016 Cash $ 176,700 $ 45,000 Accounts receivable 118,900 78,400 Investments 69,900…
A: The movement of money in and out of a business is referred to as cash flow. The cash flow statement…
Q: Questions 6 and 7 refer to the following information The following balance sheet is for X Company:…
A: As per Accounting Equation,Assets =Liabilities +Shareholder's Equity Total Equities =Total…
Q: Simon Company’s year-end balance sheets follow. At December 31 2017 2016 2015 Assets…
A: 1. Calculate the current ratio of Simon Company for the year ended 2017, 2016 and 2015:
Q: The following are financial statements of Crane Company. Crane Company Income Statement For the…
A: Number of Shares on Dividend Dates : Ratio Analysis will be done to analyze and assess the…
Q: L The Comparative balance sheet of James Inc. for December 31 2010 and 2011 is as follows: 2011 2010…
A: The cash flow statement is one of the financial statements of the business which is prepared to…
Q: LOWZ COMPANY Comparative Balance Sheet December 31…
A: $ 1 Cost of goods sold $ 270,000 Add: Increase in inventory…
Q: Simon Company's year-end balance sheets follow, At December 31 Assets Current Yr 1 Yr Ago 2 Yrs Ago…
A: Common size statements is a method of expressing each line time of a financial statement as a…
Q: Carroll Corporation: Balance Sheet as of September 1, 2021. Assets Cash 15000 Accounts Receivable…
A: The worksheet is an accounting equation indicating all the assets and liabilities and equities items…
Please answer competely
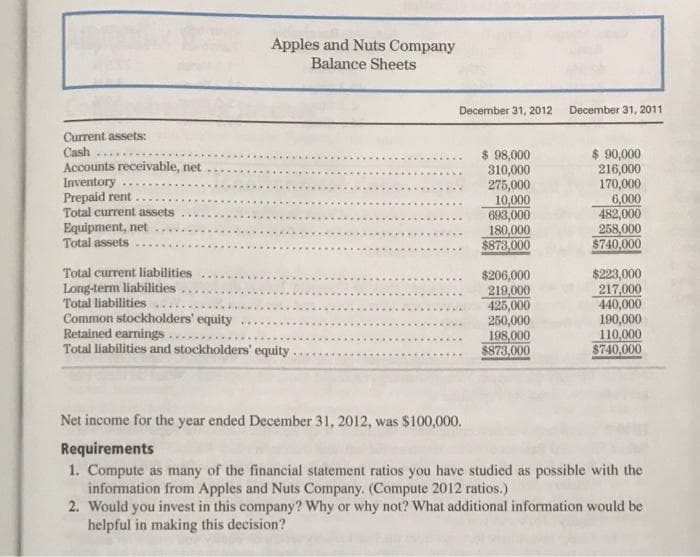
Step by step
Solved in 2 steps
- Selected comparative statement data for Oriole Company are presented below. All balance sheet data are as of December 31. 20222021Net sales$1,165,000 $1,125,000Cost of goods sold705,000 645,000Interest expense20,000 15,000Net income154,945 145,000Accounts receivable145,000 125,000Inventory105,000 100,000Total assets785,000 700,000Preferred stock (6%)205,000 200,000Total stockholders’ equity635,000 525,000 Compute the following ratios for 2022. (Round answers to 1 decimal place, e.g. 1.8 or 2.5%) (a)Profit marginenter the profit margin in percentages %(b)Asset turnoverenter the asset turnover in times times(c)Return on assetsenter the return on assets in percentages %(d)Return on common stockholders’ equityenter the return on common stockholders' equity in percentages %SalesOperating costs (excluding depreciation and amortization) EBITDADepreciation and amortization Earnings before interest and taxes Interest Earnings before taxesTaxes (40%)Net income available to common stockholders Common dividendsSEBRINGCORPORATION: BALANCESHEETSFORYEARENDINGDECEMBER31 (FIGURES ARE STATED IN MILLIONS) Assets: Cash and marketable securities Accounts receivableInventories Total current assets Gross Fixed Assets Less DepreciationNet plant and equipment Total assets 2005 2004 $3,600.0 $3,000.0 $3,060.0 $2,550.0 $540.0 $450.0 90.0 75.0 $450.0 $375.0 65.0 60.0 $385.0 $315.0 154.0 126.0 $231.0 $189.0 $15.0 $13.0 2005 2004 $ 36.00 $ 30.00 $ 340.00 $ 250.00 $ 457.00 $ 351.00 $ 833.00 $ 631.00 $ 1,065.00 $ 825.00 $ (165.00) $ (75.00) $ 900.00 $ 750.00 $ 1,733.00 $ 1,381.00 $ 324.00 $ 270.00 $ 201.00 $ 155.00 $ 216.00 $ 180.00 $ 741.00 $ 605.00 $ 450.00 $ 450.00 $ 1,191.00 $ 1,055.00 $ 150.00 $ 150.00 $ 392.00 $ 176.00 $ 542.00 $ 326.00 $ 1,733.00 $ 1,381.00…Current Attempt in Progress XYZ provided the following financial information: XYZBalance SheetAs of 12/31/19 Assets: Liabilities and Equity: Cash and marketable securities $27,476 Accounts payable and accruals $154,860 Accounts receivable $143,519 Short-term notes payable $21,255 Inventory $212,379 Total current liabilities $176,115 Total current assets $383,374 Long term debt $155,510 Net plant and equipment $602,704 Total liabilities $331,625 Goodwill and other assets $42,422 Common stock $312,719 Retained earnings $384,156 Total assets $1,028,500 Total liabilities and equity $1,028,500 In addition, it was reported that the firm had a net income of: $158,402 and net sales of: $4,272,431 Calculate the following ratios for this firm (Use 365 days for calculation. Round answers to 2 decimal places, e.g.…
- wo Company Comparison CONSOLIDATED BALANCE SHEETS Fiscal Year-End -20xx Fiscal Year - 20xx Company A Company B ASSETS Current assets: Cash $162055 $87148 Accounts Receivable $69541 $157472 Inventory $98118 $128024 Prepaid insurance $124346 $57301 Prepaid rent $158319 $132855 Other $72587 $170352 Total Current Assets Non-Current Assets Land $109144 $181575 Equipment $152782 $115712 Notes receivable $188302 $77961 Total Assets Liabilities Current Liabilities Accounts payable $185309 $56139 Accrued payroll and benefits $183788 $72118 Other $72587 $170352 Total Current Liabilities Non-Current Liabilities Long Term debt $84770 $156446 Other Long Term debt $145647 $174676 Total Non-Current Liabilities Shareholders Equity Common Shares Total Shareholders Equity Liabilities & Sharehoders`Equity Find the Debt Ratio for Company B.The comparative balance sheet of Merrick Equipment Co. for Dec. 31, 20Y9 and 20Y8, is:Dec. 31, 20Y9 Dec. 31, 20Y8AssetsCash $70,720 $47,940Accounts receivable (net) 207,230 188,190Inventories 298,520 289,850Investments 0 102,000Land 295,800 0Equipment 438,600 358,020Accumulated depreciation—equipment (99,110) (84,320)Total assets $1,211,760 $901,680Liabilities and Stockholders' EquityAccounts payable (merchandise creditors) $205,700 $194,140Accrued expenses payable (operating expenses) 30,600 26,860Dividends payable 25,500 20,400Common stock, $1 par 202,000 102,000Paid-in capital: Excess of issue price over par—common stock 354,000 204,000Retained earnings 393,960 354,280Total liabilities and stockholders' equity $1,211,760 $901,680The income statement for the year ended December 31, 20Y9, is as follows:Sales $2,023,898Cost of goods sold 1,245,476Gross profit $778,422Operating expenses:Depreciation expense $14,790Other operating expenses 517,299Total operating expenses 532,089Operating…React Corporation Comparative Statements of Financial Position December 31, 2025 and 2024 2025 2024 Assets Current Assets Cash & Cash Equivalent 106,789 102,375 Trade & Other Receivables 327,611 277,467 Inventory 331,863 297,654 Prepaid Expenses 101,565 114,813 Total Current Assets 870,828 792,309 Noncurrent Assets Property, Plant & Equipment Intangibles 135,754 166,481 Total Noncurrent Assets 7,500 7,500 TOTAL ASSETS 143,254 173,981 1,014,082 966,290 Liabilities and Shareholders’ Equity Current Liabilities Trade & Other Payables Unearned Revenues 238,000 208,703 Notes Payables - current 107,508 82,456 Total Current Liabilities 45,000 45,000…
- Assignment (kshs)The following balances are extracted from the books of XYZ Ltd at the end of May 2008 and 2009. 2008 2009DetailsDebtors 85,000 105,000Stock 45,000 35,000Creditors 40,000 63,000Provision for taxation 20,000 25,000Proposed dividend 30,000 30,000Bank overdraft 25,000 17,000Sales 1,200,000…Swifty Corporation’s comparative balance sheets are presented below. SWIFTY CORPORATIONBalance SheetsDecember 3120222021Cash$12,500 $6,100 Accounts receivable18,400 26,600 Inventory13,200 10,200 Land34,200 30,200 Building76,200 76,200 Accumulated depreciation(17,200) (14,200)Total137,300 135,100 Accounts payable19,500 33,300 Common stock ($5 par)74,500 74,500 Retained earnings43,300 27,300 Total137,300 135,100 Swifty’s 2022 income statement included net sales of $122,000, cost of goods sold of $82,000, and net income of $31,000. Compute the following ratios for 2022. (Round Debt to total assets ratio to 1 decimal place, e.g 1.8 and all percentage and days answers to 0 decimal places, e.g 18 or 25% and all other answers to 2 decimal places, e.g. 1.83) (a)Current ratioenter the ratio rounded to 2 decimal places (b)Acid-test ratioenter the ratio rounded to 2 decimal places…Swifty Corporation’s comparative balance sheets are presented below. SWIFTY CORPORATIONBalance SheetsDecember 3120222021Cash$12,500 $6,100 Accounts receivable18,400 26,600 Inventory13,200 10,200 Land34,200 30,200 Building76,200 76,200 Accumulated depreciation(17,200) (14,200)Total137,300 135,100 Accounts payable19,500 33,300 Common stock ($5 par)74,500 74,500 Retained earnings43,300 27,300 Total137,300 135,100 Swifty’s 2022 income statement included net sales of $122,000, cost of goods sold of $82,000, and net income of $31,000. Compute the following ratios for 2022. (Round Debt to total assets ratio to 1 decimal place, e.g 1.8 and all percentage and days answers to 0 decimal places, e.g 18 or 25% and all other answers to 2 decimal places, e.g. 1.83) Inventory turnoverenter the number rounded to 2 decimal places Days in inventoryenter the number of days rounded to 0 decimal…
- Swifty Corporation’s comparative balance sheets are presented below. SWIFTY CORPORATIONBalance SheetsDecember 3120222021Cash$12,500 $6,100 Accounts receivable18,400 26,600 Inventory13,200 10,200 Land34,200 30,200 Building76,200 76,200 Accumulated depreciation(17,200) (14,200)Total137,300 135,100 Accounts payable19,500 33,300 Common stock ($5 par)74,500 74,500 Retained earnings43,300 27,300 Total137,300 135,100 Swifty’s 2022 income statement included net sales of $122,000, cost of goods sold of $82,000, and net income of $31,000. Compute the following ratios for 2022. (Round Debt to total assets ratio to 1 decimal place, e.g 1.8 and all percentage and days answers to 0 decimal places, e.g 18 or 25% and all other answers to 2 decimal places, e.g. 1.83)Swifty Corporation’s comparative balance sheets are presented below. SWIFTY CORPORATIONBalance SheetsDecember 3120222021Cash$12,500 $6,100 Accounts receivable18,400 26,600 Inventory13,200 10,200 Land34,200 30,200 Building76,200 76,200 Accumulated depreciation(17,200) (14,200)Total137,300 135,100 Accounts payable19,500 33,300 Common stock ($5 par)74,500 74,500 Retained earnings43,300 27,300 Total137,300 135,100 Swifty’s 2022 income statement included net sales of $122,000, cost of goods sold of $82,000, and net income of $31,000. Compute the following ratios for 2022. (Round Debt to total assets ratio to 1 decimal place, e.g 1.8 and all percentage and days answers to 0 decimal places, e.g 18 or 25% and all other answers to 2 decimal places, e.g. 1.83) Inventory turnoverenter the number rounded to 2 decimal places Days in inventoryenter the number of days rounded to 0 decimal…Swifty Corporation’s comparative balance sheets are presented below. SWIFTY CORPORATIONBalance SheetsDecember 3120222021Cash$12,500 $6,100 Accounts receivable18,400 26,600 Inventory13,200 10,200 Land34,200 30,200 Building76,200 76,200 Accumulated depreciation(17,200) (14,200)Total137,300 135,100 Accounts payable19,500 33,300 Common stock ($5 par)74,500 74,500 Retained earnings43,300 27,300 Total137,300 135,100 Swifty’s 2022 income statement included net sales of $122,000, cost of goods sold of $82,000, and net income of $31,000. Compute the following ratios for 2022. (Round Debt to total assets ratio to 1 decimal place, e.g 1.8 and all percentage and days answers to 0 decimal places, e.g 18 or 25% and all other answers to 2 decimal places, e.g. 1.83) (i)Earnings per share$enter a dollar amount rounded to 2 decimal places (j)Payout ratioenter percentages rounded to 0 decimal…