Apply the exponential smoothing technique with exponential smoothing constant a = 0.3 to the following data for period 1 through 10 and compute forecasting errors also. Time Period 12 3 4 5 6 789 10 Gasoline Sales 39 37 61 58 | 18 | 56 | 82 27 | 41 | 69
Apply the exponential smoothing technique with exponential smoothing constant a = 0.3 to the following data for period 1 through 10 and compute forecasting errors also. Time Period 12 3 4 5 6 789 10 Gasoline Sales 39 37 61 58 | 18 | 56 | 82 27 | 41 | 69

Linear Algebra: A Modern Introduction
4th Edition
ISBN:9781285463247
Author:David Poole
Publisher:David Poole
Chapter4: Eigenvalues And Eigenvectors
Section4.6: Applications And The Perron-frobenius Theorem
Problem 25EQ

Related questions
Question
100%
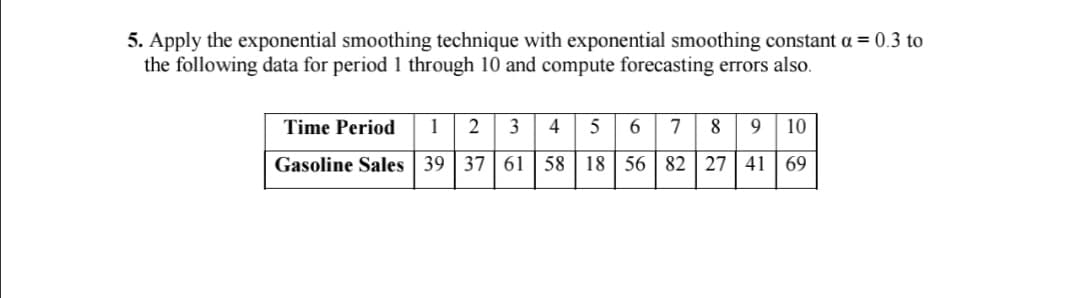
Transcribed Image Text:5. Apply the exponential smoothing technique with exponential smoothing constant a = 0.3 to
the following data for period 1 through 10 and compute forecasting errors also.
Time Period
1
2
3
4
6.
7
8
10
Gasoline Sales | 39 | 37 61
58 | 18 | 56 82 | 27 | 41
69
Expert Solution
This question has been solved!
Explore an expertly crafted, step-by-step solution for a thorough understanding of key concepts.

This is a popular solution!

Trending now
This is a popular solution!

Step by step
Solved in 2 steps with 2 images

Knowledge Booster


Learn more about
Need a deep-dive on the concept behind this application? Look no further. Learn more about this topic, statistics and related others by exploring similar questions and additional content below.Recommended textbooks for you
Linear Algebra: A Modern Introduction
Algebra
ISBN:
9781285463247
Author:
David Poole
Publisher:
Cengage Learning

Glencoe Algebra 1, Student Edition, 9780079039897…
Algebra
ISBN:
9780079039897
Author:
Carter
Publisher:
McGraw Hill

College Algebra
Algebra
ISBN:
9781305115545
Author:
James Stewart, Lothar Redlin, Saleem Watson
Publisher:
Cengage Learning
Linear Algebra: A Modern Introduction
Algebra
ISBN:
9781285463247
Author:
David Poole
Publisher:
Cengage Learning
Glencoe Algebra 1, Student Edition, 9780079039897…
Algebra
ISBN:
9780079039897
Author:
Carter
Publisher:
McGraw Hill
College Algebra
Algebra
ISBN:
9781305115545
Author:
James Stewart, Lothar Redlin, Saleem Watson
Publisher:
Cengage Learning

Algebra and Trigonometry (MindTap Course List)
Algebra
ISBN:
9781305071742
Author:
James Stewart, Lothar Redlin, Saleem Watson
Publisher:
Cengage Learning