Using simple exponential smoothing and the following time series data, respond to each of the items.   Period Demand 1 72 2 60 3 27 4 52 5 26 6 46 7 52 8 28 9 53 10 50 11 57 12 87 13 22 14 56

College Algebra
1st Edition
ISBN:9781938168383
Author:Jay Abramson
Publisher:Jay Abramson
Chapter6: Exponential And Logarithmic Functions
Section6.8: Fitting Exponential Models To Data
Problem 3TI: Table 6 shows the population, in thousands, of harbor seals in the Wadden Sea over the years 1997 to...
icon
Related questions
icon
Concept explainers
Question

Using simple exponential smoothing and the following time series data, respond to each of the items.
 

Period Demand
1 72
2 60
3 27
4 52
5 26
6 46
7 52
8 28
9 53
10 50
11 57
12 87
13 22
14 56

I need help! Please explain, thanks.

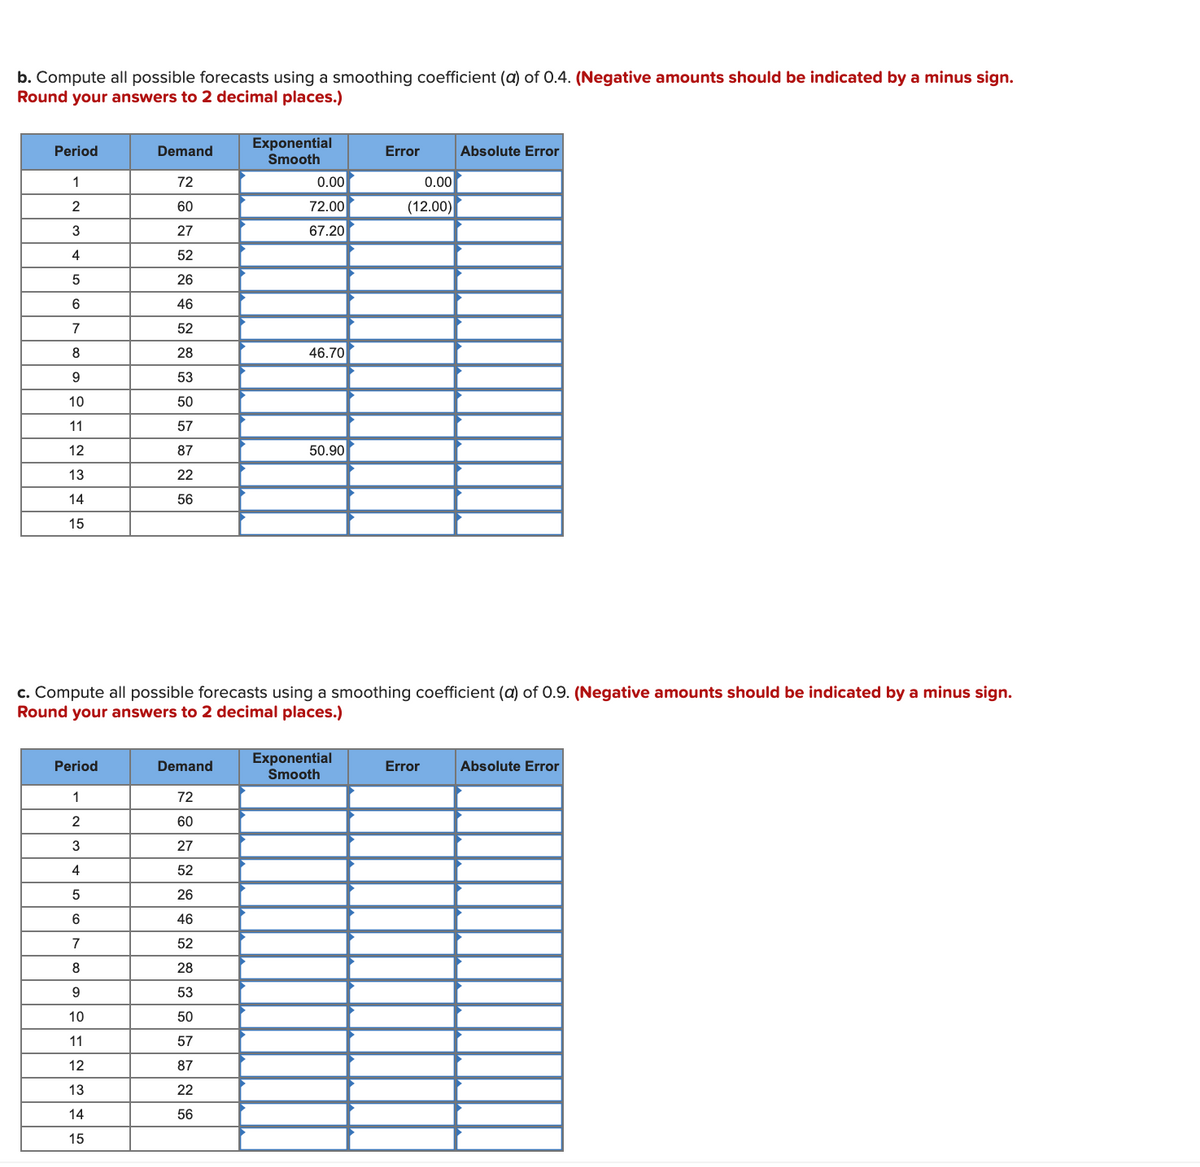
b. Compute all possible forecasts using a smoothing coefficient (a) of 0.4. (Negative amounts should be indicated by a minus sign.
Round your answers to 2 decimal places.)
Exponential
Smooth
Absolute Error
Period
Demand
Error
1
72
0.00
0.00
2
60
72.00
(12.00)
27
67.20
4
52
26
46
7
52
8
28
46.70
53
10
50
11
57
12
87
50.90
13
22
14
56
15
c. Compute all possible forecasts using a smoothing coefficient (a) of 0.9. (Negative amounts should be indicated by a minus sign.
Round your answers to 2 decimal places.)
Exponential
Smooth
Period
Demand
Error
Absolute Error
1
72
60
3
27
4
52
26
6
46
7
52
28
53
10
50
11
57
12
87
13
22
14
56
15
Transcribed Image Text:b. Compute all possible forecasts using a smoothing coefficient (a) of 0.4. (Negative amounts should be indicated by a minus sign. Round your answers to 2 decimal places.) Exponential Smooth Absolute Error Period Demand Error 1 72 0.00 0.00 2 60 72.00 (12.00) 27 67.20 4 52 26 46 7 52 8 28 46.70 53 10 50 11 57 12 87 50.90 13 22 14 56 15 c. Compute all possible forecasts using a smoothing coefficient (a) of 0.9. (Negative amounts should be indicated by a minus sign. Round your answers to 2 decimal places.) Exponential Smooth Period Demand Error Absolute Error 1 72 60 3 27 4 52 26 6 46 7 52 28 53 10 50 11 57 12 87 13 22 14 56 15
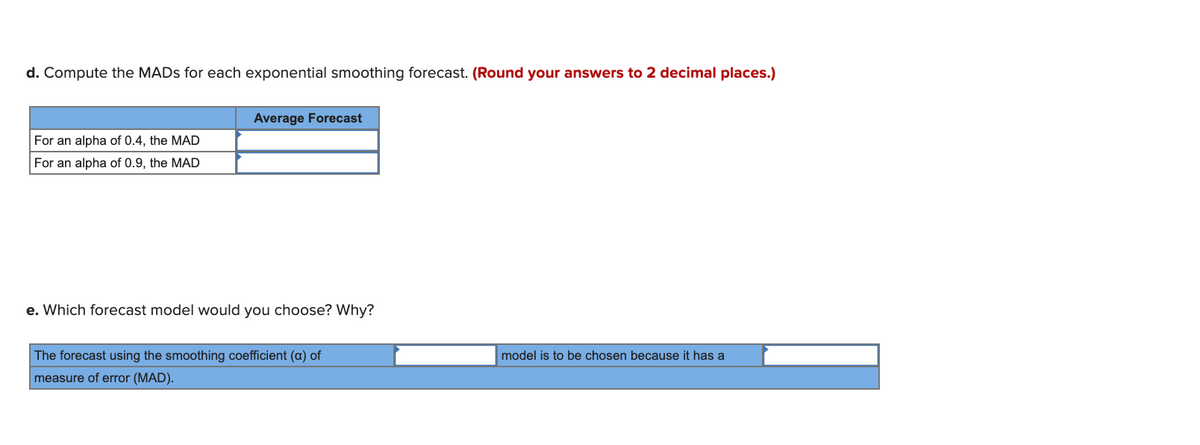
d. Compute the MADS for each exponential smoothing forecast. (Round your answers to 2 decimal places.)
Average Forecast
For an alpha of 0.4, the MAD
For an alpha of 0.9, the MAD
e. Which forecast model would you choose? Why?
The forecast using the smoothing coefficient (a) of
model is to be chosen because it has a
measure of error (MAD).
Transcribed Image Text:d. Compute the MADS for each exponential smoothing forecast. (Round your answers to 2 decimal places.) Average Forecast For an alpha of 0.4, the MAD For an alpha of 0.9, the MAD e. Which forecast model would you choose? Why? The forecast using the smoothing coefficient (a) of model is to be chosen because it has a measure of error (MAD).
Expert Solution
trending now

Trending now

This is a popular solution!

steps

Step by step

Solved in 2 steps

Blurred answer
Knowledge Booster
Correlation, Regression, and Association
Learn more about
Need a deep-dive on the concept behind this application? Look no further. Learn more about this topic, statistics and related others by exploring similar questions and additional content below.
Similar questions
  • SEE MORE QUESTIONS
Recommended textbooks for you
College Algebra
College Algebra
Algebra
ISBN:
9781938168383
Author:
Jay Abramson
Publisher:
OpenStax
Algebra & Trigonometry with Analytic Geometry
Algebra
ISBN:
9781133382119
Author:
Swokowski
Publisher:
Cengage
College Algebra
College Algebra
Algebra
ISBN:
9781305115545
Author:
James Stewart, Lothar Redlin, Saleem Watson
Publisher:
Cengage Learning
Glencoe Algebra 1, Student Edition, 9780079039897…
Algebra
ISBN:
9780079039897
Author:
Carter
Publisher:
McGraw Hill