Week Actual Forecast Demand 1 52 48 2 42 46 3 56 52 4 45 47 true or false Assume that the actual demand is representative of a repeating pattern over 4 weeks. The cyclical index for Week 1 is (approximately) 1.07 The forecast of demand for Week 5 (F5) using a Simple Moving Average (SMA) with 3 weeks is 48.75. The forecast of demand for Week 5 (F5) using exponential smoothing with alpha = 0.3 is 46.4.
Week Actual Forecast Demand 1 52 48 2 42 46 3 56 52 4 45 47 true or false Assume that the actual demand is representative of a repeating pattern over 4 weeks. The cyclical index for Week 1 is (approximately) 1.07 The forecast of demand for Week 5 (F5) using a Simple Moving Average (SMA) with 3 weeks is 48.75. The forecast of demand for Week 5 (F5) using exponential smoothing with alpha = 0.3 is 46.4.

Practical Management Science
6th Edition
ISBN:9781337406659
Author:WINSTON, Wayne L.
Publisher:WINSTON, Wayne L.
Chapter13: Regression And Forecasting Models
Section13.6: Moving Averages Models
Problem 19P: The file P13_19.xlsx contains the weekly sales of a particular brand of paper towels at a...

Related questions
Question
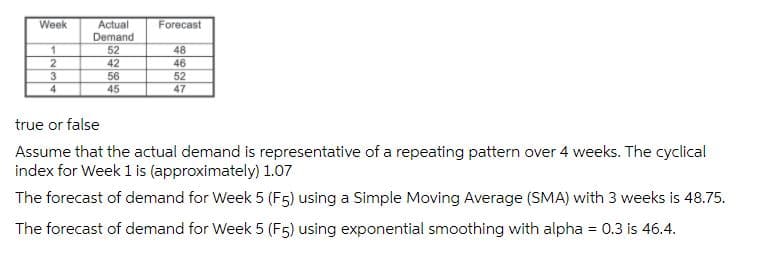
Transcribed Image Text:Week
Forecast
Actual
Demand
52
48
42
46
3
56
52
4
45
47
true or false
Assume that the actual demand is representative of a repeating pattern over 4 weeks. The cyclical
index for Week 1 is (approximately) 1.07
The forecast of demand for Week 5 (F5) using a Simple Moving Average (SMA) with 3 weeks is 48.75.
The forecast of demand for Week 5 (F5) using exponential smoothing with alpha = 0.3 is 46.4.
Expert Solution
This question has been solved!
Explore an expertly crafted, step-by-step solution for a thorough understanding of key concepts.

This is a popular solution!

Trending now
This is a popular solution!

Step by step
Solved in 3 steps

Recommended textbooks for you
Practical Management Science
Operations Management
ISBN:
9781337406659
Author:
WINSTON, Wayne L.
Publisher:
Cengage,

Contemporary Marketing
Marketing
ISBN:
9780357033777
Author:
Louis E. Boone, David L. Kurtz
Publisher:
Cengage Learning

Marketing
Marketing
ISBN:
9780357033791
Author:
Pride, William M
Publisher:
South Western Educational Publishing
Practical Management Science
Operations Management
ISBN:
9781337406659
Author:
WINSTON, Wayne L.
Publisher:
Cengage,
Contemporary Marketing
Marketing
ISBN:
9780357033777
Author:
Louis E. Boone, David L. Kurtz
Publisher:
Cengage Learning
Marketing
Marketing
ISBN:
9780357033791
Author:
Pride, William M
Publisher:
South Western Educational Publishing