
MATLAB: An Introduction with Applications
6th Edition
ISBN: 9781119256830
Author: Amos Gilat
Publisher: John Wiley & Sons Inc
expand_more
expand_more
format_list_bulleted
Related questions
Question

Transcribed Image Text:**Educational Website Text: Analysis of Good Citizenship Beliefs Using the GSS 2014 Data**
**Overview:**
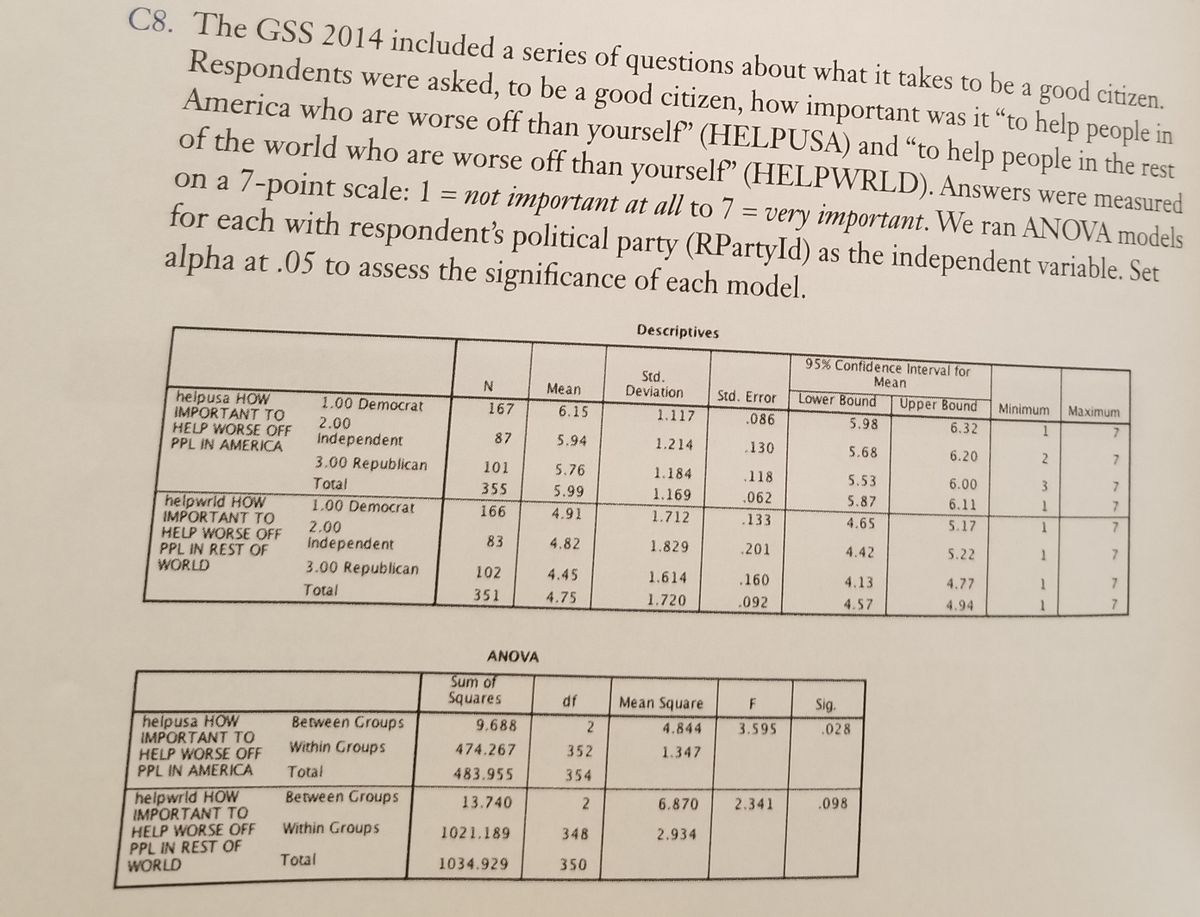
The 2014 General Social Survey (GSS) explored views on citizenship by asking participants to rate the importance of helping those who are less fortunate. The survey examined two aspects: helping people in America (HELPUSA) and helping people in the rest of the world (HELPWRLD). Respondents rated each question on a 7-point scale from 1 (not important at all) to 7 (very important).
**Study Design:**
The study conducted ANOVA tests to assess whether political affiliation (Democrat, Independent, Republican) impacts perceived importance. The significance level was set at 0.05.
**Data Summary:**
*Descriptive Statistics Table:*
- **HELPUSA:**
- **Democrats:** Mean = 6.15, SD = 1.117
- **Independents:** Mean = 5.94, SD = 1.214
- **Republicans:** Mean = 5.76, SD = 1.184
- Total respondents = 355
- **HELPWRLD:**
- **Democrats:** Mean = 4.91, SD = 1.712
- **Independents:** Mean = 4.82, SD = 1.829
- **Republicans:** Mean = 4.48, SD = 1.614
- Total respondents = 351
The table also includes 95% confidence intervals for the means and observed minimum and maximum values.
*ANOVA Results:*
- **HELPUSA:**
- Between Groups: Sum of Squares = 9.688, Mean Square = 4.844, F = 3.595, p = 0.028
- Significant differences exist across political groups.
- **HELPWRLD:**
- Between Groups: Sum of Squares = 13.740, Mean Square = 6.870, F = 2.341, p = 0.098
- No significant differences found across political groups.
**Interpretation:**
The findings suggest differing views among political affiliations regarding the importance of helping the less fortunate in the USA, with Democrats rating it higher compared to Independents and Republicans. However, no significant differences were observed for helping those in the rest of the world.
This analysis enhances understanding of how
Expert Solution
This question has been solved!
Explore an expertly crafted, step-by-step solution for a thorough understanding of key concepts.

This is a popular solution

Trending nowThis is a popular solution!

Step by stepSolved in 3 steps with 3 images

Knowledge Booster

Similar questions
- When writing the participant section for your formal report, you include only information that directly describes your participants, and do not include information on measures they have completed. True or falsearrow_forwardIn a survey, respondents were asked to disclose their political affiliation (Democrat, Independent, Republican) and also answer the question "Would you be willing to pay higher taxes if the tax revenue went directly toward deficit reduction?" Create a contingency table and determine whether the results suggest there is an association between political affiliation and willingness to pay higher taxes to directly reduce the federal debt. Use the a= 0.05 level of significance. Click the icon to view the results of the survey. Construct a contingency table. Democrat Independent Republican Willing to pay higher taxes? Yes. No 9 7 6 3 11 14arrow_forwardA consumer group wanted to determine if there was a difference in customer perceptions about prices for a specific type of toy depending on where the toy was purchased. In the local area there are three main retailers: W-Mart, Tag, and URToy. For each retailer, the consumer group randomly selected 5 customers, and asked them to rate how expensive they thought the toy was on a 1-to-10 scale (1= not expensive, to 10 = very expensive). The toy was priced the same at all retail stores. Compute the percentage of variance explained by the group differences for these data. Q: Percentage and variance explained = ?arrow_forward
- Researchers were interested in how much time balance (i.e., the degree to which you have enough time to do what you like) is related to happiness. They asked 12 adults to answer two questions (on 1 – 8 scales): (a) in a typical week, how much of your time are you able to spend doing the kinds of things that you enjoy (with higher scores indicating more time balance) and (b) taking all things together, how happy would you say you are (with higher scores indicating more happiness)? The research hypothesis is that there is an association between time balance and happiness. Use the Table of Descriptive statistics, correlation (r), the standard error of the correlation (SEr), and the r to zr Table, to go through the steps to compute the 95% CI. Report all values (excluding critical values) to TWO decimal places.Report critical values to THREE decimal places. Compute the following: Report all values to TWO decimal places.The Pearson Correlation = Answer Standard Error (SEr) = Answertobs =…arrow_forwardA substance abuse counselor wants to demonstrate the effect of situational stress on alcohol cravings. He recruits two groups of men who are similar in respect to history of alcohol use and demographic variables. He divides them in to two groups. In one group(n=11), the men are exposed to a stressful situation and then asked to complete a measure rating their alcohol cravings on a scale from 0-10, where 0 representsno cravings and 10 represents intense cravings. In the second group (n=10), the men are exposed to a neutral situation and asked to complete the same measure. What test and graph should I create to find out if a stressful situation result in more intense alcohol cravings than a non-stressful situation?arrow_forwardquestions are not graded.arrow_forward
- the variable "jobwant" measures what people look for in a job. participants were asked to select ONE from the following answer options: high income; no danger being fired; working hours are short with lots of free time; chances for advancment; work that is important and gives a feeling of accomplishment. these options were then given a numerical value of 1 through 5 and were entered in to SPSS. based on this description of the "job want" variable, the best mesure of central tendency for this variable is_____ -mode -frequency -mean -medianarrow_forwardA teacher is concerned that she may be biased in her interaction with students. She keeps track of the number of interactions she has with her students and also notes the student's gender. She records the results in a contingency table. Interaction YES NO Boy 7 13 Girl 15 Is there a significant relationship between the interactions and the student's gender, using a = .05?arrow_forwardThe Bureau of Labor Statistics reports that the official unemployment rate for Black people was 10.4% and 4.7% for White people in February 2015. Select all correct answers for this question. O The samples of white and black people are independent. The explanatory variable is the unemployment rate. The response variable is the unemployment rate. The response variable is race.arrow_forward
- By a small margin, Facebook remains the top choice of social media over all ages, with 29% using Facebook most often among those using social media sites. However, more visually oriented social networks such as Snapchat and Instagram continue to draw in younger audiences. When asked "Which one social networking brand do you use most often?" the results in the table show the top brands chosen by Americans aged 12-34 who currently use any social networking site or service. Social M edia Site Faceboo k Snapchat Instagra m Twitter Percentage That Use Most Often 29 28 26 6 20 (a) What is the sum of the percentages for these top social media sites? Give your answer as an exact number. Macmillan Learning top social media sites: What percent of Americans aged 12-34 use other social media sites most often? Give your answer as an exact number. other social media sites: do %arrow_forwardSuppose you have collected data on 1000 customers who visited your company's website last week. For each customer, the time spent on the page and the total amount of customer purchases during the visit were recorded. You want to explore the relationship between these two variables. What is the explanatory variable and what is the response variable? to. Explanatory: Time spent on the page Answer: Total amount of purchases b. It is not possible since neither explains c. Answer: Time spent on the page Explanatory: Total amount of purchasesarrow_forwardIn a study assessing helping behavior among college students on their way to class, you recruit 10 students. You tell some participants that they are late for class and need to rush. You tell others they are right on time. Finally, you tell others they have lots of time before class. As they walk across campus, they come across a man (actually a confederate) who appears to need help. You measure the extent to which the participant noticed that the confederate needed help (1 = did not notice to 9 = really noticed). Which hypothesis test would you calculate? F test Independent sample t-test z test Dependent sample t-testarrow_forward
arrow_back_ios
SEE MORE QUESTIONS
arrow_forward_ios
Recommended textbooks for you
- MATLAB: An Introduction with ApplicationsStatisticsISBN:9781119256830Author:Amos GilatPublisher:John Wiley & Sons Inc
 Probability and Statistics for Engineering and th...StatisticsISBN:9781305251809Author:Jay L. DevorePublisher:Cengage Learning
 Statistics for The Behavioral Sciences (MindTap C...StatisticsISBN:9781305504912Author:Frederick J Gravetter, Larry B. WallnauPublisher:Cengage Learning
  Elementary Statistics: Picturing the World (7th E...StatisticsISBN:9780134683416Author:Ron Larson, Betsy FarberPublisher:PEARSON
 The Basic Practice of StatisticsStatisticsISBN:9781319042578Author:David S. Moore, William I. Notz, Michael A. FlignerPublisher:W. H. Freeman
 Introduction to the Practice of StatisticsStatisticsISBN:9781319013387Author:David S. Moore, George P. McCabe, Bruce A. CraigPublisher:W. H. Freeman
MATLAB: An Introduction with Applications
Statistics
ISBN:9781119256830
Author:Amos Gilat
Publisher:John Wiley & Sons Inc
Probability and Statistics for Engineering and th...
Statistics
ISBN:9781305251809
Author:Jay L. Devore
Publisher:Cengage Learning
Statistics for The Behavioral Sciences (MindTap C...
Statistics
ISBN:9781305504912
Author:Frederick J Gravetter, Larry B. Wallnau
Publisher:Cengage Learning
Elementary Statistics: Picturing the World (7th E...
Statistics
ISBN:9780134683416
Author:Ron Larson, Betsy Farber
Publisher:PEARSON
The Basic Practice of Statistics
Statistics
ISBN:9781319042578
Author:David S. Moore, William I. Notz, Michael A. Fligner
Publisher:W. H. Freeman
Introduction to the Practice of Statistics
Statistics
ISBN:9781319013387
Author:David S. Moore, George P. McCabe, Bruce A. Craig
Publisher:W. H. Freeman