3. www.w 3. Experiment 35 Report Sheet Spectrophotometric Metal lon Analysis Date Lab Sec. Name Desk No. Metal Ion for Analysis A. A Set of Standard Solutions 1. Prepare a stock solution. Show the calculation for the mass of metal ion salt in the preparation of the stock solution. See Prelaboratory Assignment, question 2a. 1. 100mL x 1L/ 1000mL x0.10mol / 1L x 249.68g = 2.5g CUSO4×5H2O %3D Measured tared mass of metal ion salt (g) 2.499 DescribO he preparation of the 0.10 M stock solution. .01M Concentration of stock solution (mol/L) B. Determination of Amax 2. Wavelength scan. Use the following table to record wavelength and absorbance data. Abs Abs Abs Y sqv Abs X| sq Labo Circle 1. P 610 E nm Plot the data of absorbance versus wavelength to set Amax. From the data plot, Amax 2. Pa Have the instructor approve your graph. ca C. Plot the Calibration Curve 3. Pa 1. Absorbance of standard solutions. Read and record the absorbance values for the standard solutions. Calculated Molar the Volume of Standard Solution (mL) Absorbance Concentration Standard Solution 4. Par Fe Blank .033 .095 .763 5. Par 1. Bec trati 2. hast 1.371 6. Part 4 meas 2.052 10 20 21 rema 5. others as needed .316 Experiment 35 395 S 966 etal saxe
3. www.w 3. Experiment 35 Report Sheet Spectrophotometric Metal lon Analysis Date Lab Sec. Name Desk No. Metal Ion for Analysis A. A Set of Standard Solutions 1. Prepare a stock solution. Show the calculation for the mass of metal ion salt in the preparation of the stock solution. See Prelaboratory Assignment, question 2a. 1. 100mL x 1L/ 1000mL x0.10mol / 1L x 249.68g = 2.5g CUSO4×5H2O %3D Measured tared mass of metal ion salt (g) 2.499 DescribO he preparation of the 0.10 M stock solution. .01M Concentration of stock solution (mol/L) B. Determination of Amax 2. Wavelength scan. Use the following table to record wavelength and absorbance data. Abs Abs Abs Y sqv Abs X| sq Labo Circle 1. P 610 E nm Plot the data of absorbance versus wavelength to set Amax. From the data plot, Amax 2. Pa Have the instructor approve your graph. ca C. Plot the Calibration Curve 3. Pa 1. Absorbance of standard solutions. Read and record the absorbance values for the standard solutions. Calculated Molar the Volume of Standard Solution (mL) Absorbance Concentration Standard Solution 4. Par Fe Blank .033 .095 .763 5. Par 1. Bec trati 2. hast 1.371 6. Part 4 meas 2.052 10 20 21 rema 5. others as needed .316 Experiment 35 395 S 966 etal saxe

Chapter4: Least-squares And Calibration Methods
Section: Chapter Questions
Problem 1P

Related questions
Question
100%
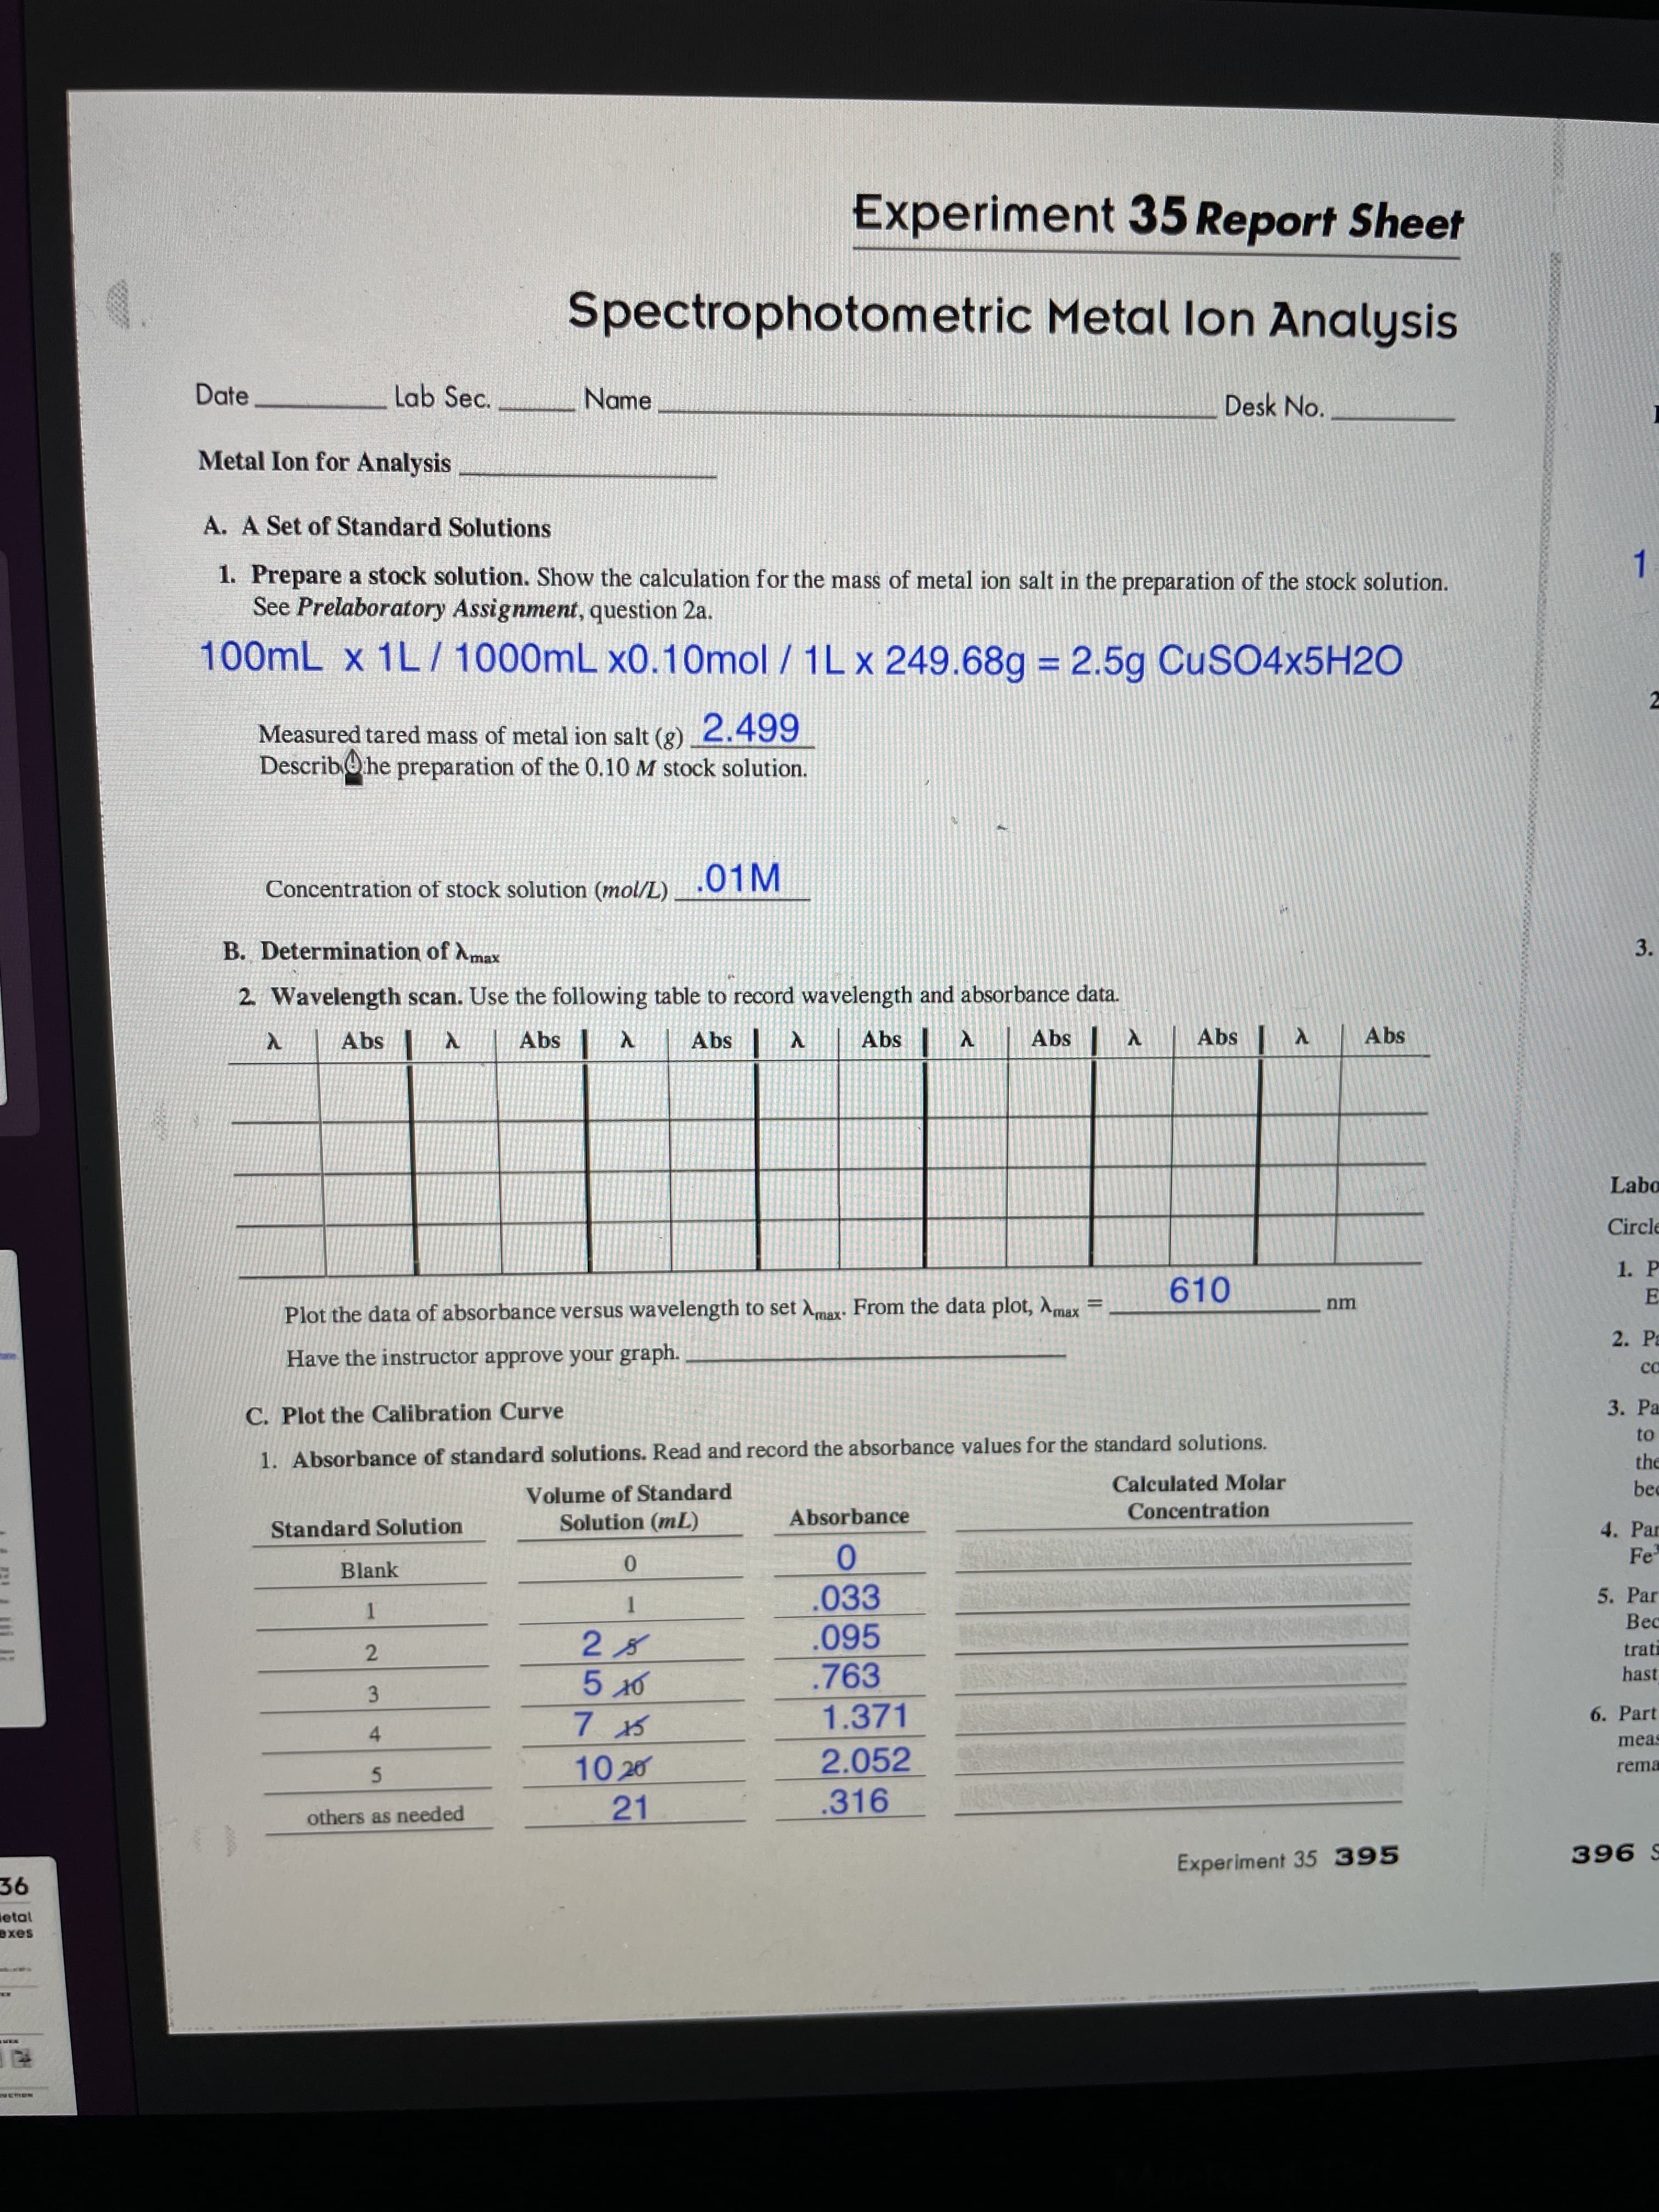
i need help calculating the molar concentration for part C
Transcribed Image Text:3.
www.w
3.
Experiment 35 Report Sheet
Spectrophotometric Metal lon Analysis
Date
Lab Sec.
Name
Desk No.
Metal Ion for Analysis
A. A Set of Standard Solutions
1. Prepare a stock solution. Show the calculation for the mass of metal ion salt in the preparation of the stock solution.
See Prelaboratory Assignment, question 2a.
1.
100mL x 1L/ 1000mL x0.10mol / 1L x 249.68g = 2.5g CUSO4×5H2O
%3D
Measured tared mass of metal ion salt (g) 2.499
DescribO he preparation of the 0.10 M stock solution.
.01M
Concentration of stock solution (mol/L)
B. Determination of Amax
2. Wavelength scan. Use the following table to record wavelength and absorbance data.
Abs
Abs
Abs
Y sqv
Abs
X| sq
Labo
Circle
1. P
610
E
nm
Plot the data of absorbance versus wavelength to set Amax. From the data plot, Amax
2. Pa
Have the instructor approve your graph.
ca
C. Plot the Calibration Curve
3. Pa
1. Absorbance of standard solutions. Read and record the absorbance values for the standard solutions.
Calculated Molar
the
Volume of Standard
Solution (mL)
Absorbance
Concentration
Standard Solution
4. Par
Fe
Blank
.033
.095
.763
5. Par
1.
Bec
trati
2.
hast
1.371
6. Part
4
meas
2.052
10 20
21
rema
5.
others as needed
.316
Experiment 35 395
S 966
etal
saxe
Expert Solution
This question has been solved!
Explore an expertly crafted, step-by-step solution for a thorough understanding of key concepts.

This is a popular solution!

Trending now
This is a popular solution!

Step by step
Solved in 2 steps with 2 images

Recommended textbooks for you

Principles of Modern Chemistry
Chemistry
ISBN:
9781305079113
Author:
David W. Oxtoby, H. Pat Gillis, Laurie J. Butler
Publisher:
Cengage Learning
Principles of Modern Chemistry
Chemistry
ISBN:
9781305079113
Author:
David W. Oxtoby, H. Pat Gillis, Laurie J. Butler
Publisher:
Cengage Learning

Chemical Principles in the Laboratory
Chemistry
ISBN:
9781305264434
Author:
Emil Slowinski, Wayne C. Wolsey, Robert Rossi
Publisher:
Brooks Cole