
MATLAB: An Introduction with Applications
6th Edition
ISBN: 9781119256830
Author: Amos Gilat
Publisher: John Wiley & Sons Inc
expand_more
expand_more
format_list_bulleted
Related questions
Question
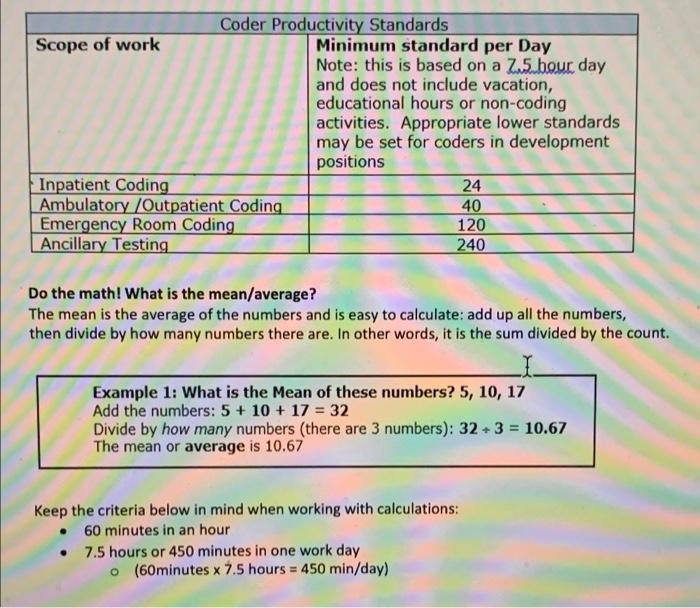

Transcribed Image Text:Coder Productivity Standards
Minimum standard per Day
Note: this is based on a Z.5 hour day
and does not include vacation,
educational hours or non-coding
activities. Appropriate lower standards
may be set for coders in development
positions
Scope of work
Inpatient Coding
Ambulatory /Outpatient Coding
Emergency Room Coding
Ancillary Testing
24
40
120
240
Do the math! What is the mean/average?
The mean is the average of the numbers and is easy to calculate: add up all the numbers,
then divide by how many numbers there are. In other words, it is the sum divided by the count.
Example 1: What is the Mean of these numbers? 5, 10, 17
Add the numbers: 5 + 10 + 17 = 32
Divide by how many numbers (there are 3 numbers): 32 +3 = 10.67
The mean or average is 10.67
%3D
Keep the criteria below in mind when working with calculations:
60 minutes in an hour
7.5 hours or 450 minutes in one work day
o (60minutes x 7.5 hours = 450 min/day)
Expert Solution
This question has been solved!
Explore an expertly crafted, step-by-step solution for a thorough understanding of key concepts.

This is a popular solution

Trending nowThis is a popular solution!

Step by stepSolved in 2 steps

Knowledge Booster

Similar questions
- Find the mean, median, and mode Scores F 95-99 10 90-94 20 85-89 25 80-84 28 75-79 12 70-74 8arrow_forwardUse the stem-and-leaf plot to list the actual data entries. What's is the maximum data entry? What is the minimum data entry?arrow_forwardUse the given minimum and maximum data entries, and the number of classes, to find the class width, the lower class limits, and the upper class limits. minimum=16, maximum=121, 8 classes Question content area bottom Part 1 The class width is enter your response here . (Type a whole number.) Part 2 Choose the correct lower class limits below. A. 16, 29, 44, 57, 71, 86, 99, 114 B. 30, 43, 58, 72, 86, 99, 113, 127 C. 16, 30, 44, 58, 72, 86, 100, 114 D. 29, 43, 58, 71, 85, 99, 114, 127 Part 3 Choose the correct upper class limits below. A. 30, 44, 58, 72, 86, 99, 114, 127 B. 29, 43, 57, 71, 85, 99, 113, 127 C. 29, 43, 58, 72, 85, 99, 113, 127 D. 30, 44, 57, 71, 86, 99, 114, 127arrow_forward
- Please construct a Pareto chart for the data displayed!arrow_forwardA mother is creating the family budget for next year and wants to come up with a single value to estimate the cost of the water bill every month based on the total from last year divided by 12 months. Which descriptive statistic should she use? O Mode O Median O Meanarrow_forwardAn epidemiologist plans to conduct a survey to estimate the percentage of women who give birth. How many women must be surveyed in order to be 99% confident that the estimated percentage is in error by no more than two percentage points? Complete parts (a) through (c) below. Question content area bottom Part 1 a. Assume that nothing is known about the percentage to be estimated. n=enter your response here (Round up to the nearest integer.) Part 2 b. Assume that a prior study conducted by an organization showed that 81% of women give birth. n=enter your response here (Round up to the nearest integer.) Part 3 c. What is wrong with surveying randomly selected adult women? A. Randomly selecting adult women would result in an overestimate, because some women will give birth to their first child after the survey was conducted. It will be important to survey women who have completed the time during which they can give birth. B. Randomly…arrow_forward
arrow_back_ios
arrow_forward_ios
Recommended textbooks for you
- MATLAB: An Introduction with ApplicationsStatisticsISBN:9781119256830Author:Amos GilatPublisher:John Wiley & Sons Inc
 Probability and Statistics for Engineering and th...StatisticsISBN:9781305251809Author:Jay L. DevorePublisher:Cengage Learning
 Statistics for The Behavioral Sciences (MindTap C...StatisticsISBN:9781305504912Author:Frederick J Gravetter, Larry B. WallnauPublisher:Cengage Learning
  Elementary Statistics: Picturing the World (7th E...StatisticsISBN:9780134683416Author:Ron Larson, Betsy FarberPublisher:PEARSON
 The Basic Practice of StatisticsStatisticsISBN:9781319042578Author:David S. Moore, William I. Notz, Michael A. FlignerPublisher:W. H. Freeman
 Introduction to the Practice of StatisticsStatisticsISBN:9781319013387Author:David S. Moore, George P. McCabe, Bruce A. CraigPublisher:W. H. Freeman
MATLAB: An Introduction with Applications
Statistics
ISBN:9781119256830
Author:Amos Gilat
Publisher:John Wiley & Sons Inc
Probability and Statistics for Engineering and th...
Statistics
ISBN:9781305251809
Author:Jay L. Devore
Publisher:Cengage Learning
Statistics for The Behavioral Sciences (MindTap C...
Statistics
ISBN:9781305504912
Author:Frederick J Gravetter, Larry B. Wallnau
Publisher:Cengage Learning
Elementary Statistics: Picturing the World (7th E...
Statistics
ISBN:9780134683416
Author:Ron Larson, Betsy Farber
Publisher:PEARSON
The Basic Practice of Statistics
Statistics
ISBN:9781319042578
Author:David S. Moore, William I. Notz, Michael A. Fligner
Publisher:W. H. Freeman
Introduction to the Practice of Statistics
Statistics
ISBN:9781319013387
Author:David S. Moore, George P. McCabe, Bruce A. Craig
Publisher:W. H. Freeman