
MATLAB: An Introduction with Applications
6th Edition
ISBN: 9781119256830
Author: Amos Gilat
Publisher: John Wiley & Sons Inc
expand_more
expand_more
format_list_bulleted
Related questions
Question
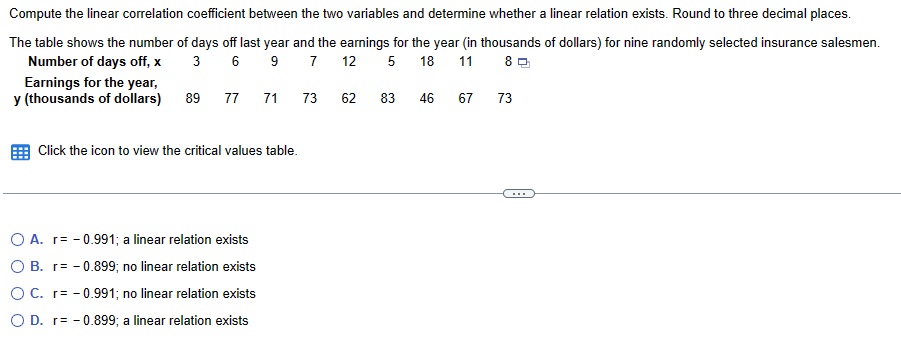

Transcribed Image Text:Compute the linear correlation coefficient between the two variables and determine whether a linear relation exists. Round to three decimal places.
The table shows the number of days off last year and the earnings for the year (in thousands of dollars) for nine randomly selected insurance salesmen.
Number of days off, x
3 6
9
7
12 5 18 11
80
Earnings for the year,
y (thousands of dollars) 89
77
71
Click the icon to view the critical values table.
O A. r= -0.991; a linear relation exists
O B. r= -0.899; no linear relation exists
O C. r= -0.991; no linear relation exists
O D. r=-0.899; a linear relation exists
73
62 83
46 67
73
Expert Solution
This question has been solved!
Explore an expertly crafted, step-by-step solution for a thorough understanding of key concepts.

This is a popular solution

Trending nowThis is a popular solution!

Step by stepSolved in 4 steps

Knowledge Booster

Similar questions
- 25 of 30 The following graph shows the mean change in mass of two groups of animals fed on different diets over a period of 2 years: Time course of mass change 275 250 225 200 175 150 125 100 0 3 69 12 15 18 21 24 Time (months) Which of these is the most misleading property of this graph? OThe errors vary between data points. O A best fit curve wasn't shown The interpolating lines have different styles. False zero None of these is relevant to this graph. Mass (g) HH H HH HH HHarrow_forwardBelow is data for two variables, X and Y. Answer the questions that follow. X Y X-MX Y-MY (X-MX)2 (Y-MY)2 (X-MX)(Y-MY) 3 3 -2 -1 4 1 2 4 3 -1 -1 1 1 ___ 6 4 1 ___ 1 0 0 7 6 2 2 ___ 4 4 r = ____arrow_forwardBased on the line of best fit for the data below, select which choice best predicts the y-value when the x-value is 10. -80 -75 -70 -65 -60 -55- -50+ -45- -40- -35 -30- -25 -20+ -15 -10 -5- 0 O O O O 96 80 91 85 8 10 11 12arrow_forward
- Please helparrow_forwardThe scatter plot shows the number of hours worked and money spent on entertainment by each of 24 students. Also shown is the line of best fit for the data. Fill in the blanks below. 70 65 60 55. Amount of 50 × 45 money spent on entertainment 40+ (in dollars) 35. × × 30 25 20 15. × 10+ 5-x 0 6 8 10 12 14 16 18 20 22 Number of hours worked (a) For these 24 students, as the number of hours increases, the amount of money spent tends to (Choose one) (b) For these 24 students, there is (Choose one) money spent. correlation between the number of hours worked and the amount of (c) Using the line of best fit, we would predict that a student working 8 hours would spend approximately (Choose one) ▼ ك ?arrow_forwardThe scatter plot shows the relationship between the number of minutes studying for a test (x) and the Score earned (y). Make a scatterplot for the data. Time Studying (x) 40 50 60 70 80 90 100 110 Score (y) 2 3 6 7 9. +H+ 10 6. -7- 4 3 1- 10, 10 20 30 40 50 60 70 80 90 100 110 12 7:04 PM Desktop 12/8/2026arrow_forward
arrow_back_ios
arrow_forward_ios
Recommended textbooks for you
- MATLAB: An Introduction with ApplicationsStatisticsISBN:9781119256830Author:Amos GilatPublisher:John Wiley & Sons Inc
 Probability and Statistics for Engineering and th...StatisticsISBN:9781305251809Author:Jay L. DevorePublisher:Cengage Learning
 Statistics for The Behavioral Sciences (MindTap C...StatisticsISBN:9781305504912Author:Frederick J Gravetter, Larry B. WallnauPublisher:Cengage Learning
  Elementary Statistics: Picturing the World (7th E...StatisticsISBN:9780134683416Author:Ron Larson, Betsy FarberPublisher:PEARSON
 The Basic Practice of StatisticsStatisticsISBN:9781319042578Author:David S. Moore, William I. Notz, Michael A. FlignerPublisher:W. H. Freeman
 Introduction to the Practice of StatisticsStatisticsISBN:9781319013387Author:David S. Moore, George P. McCabe, Bruce A. CraigPublisher:W. H. Freeman
MATLAB: An Introduction with Applications
Statistics
ISBN:9781119256830
Author:Amos Gilat
Publisher:John Wiley & Sons Inc
Probability and Statistics for Engineering and th...
Statistics
ISBN:9781305251809
Author:Jay L. Devore
Publisher:Cengage Learning
Statistics for The Behavioral Sciences (MindTap C...
Statistics
ISBN:9781305504912
Author:Frederick J Gravetter, Larry B. Wallnau
Publisher:Cengage Learning
Elementary Statistics: Picturing the World (7th E...
Statistics
ISBN:9780134683416
Author:Ron Larson, Betsy Farber
Publisher:PEARSON
The Basic Practice of Statistics
Statistics
ISBN:9781319042578
Author:David S. Moore, William I. Notz, Michael A. Fligner
Publisher:W. H. Freeman
Introduction to the Practice of Statistics
Statistics
ISBN:9781319013387
Author:David S. Moore, George P. McCabe, Bruce A. Craig
Publisher:W. H. Freeman