
MATLAB: An Introduction with Applications
6th Edition
ISBN: 9781119256830
Author: Amos Gilat
Publisher: John Wiley & Sons Inc
expand_more
expand_more
format_list_bulleted
Related questions
Question
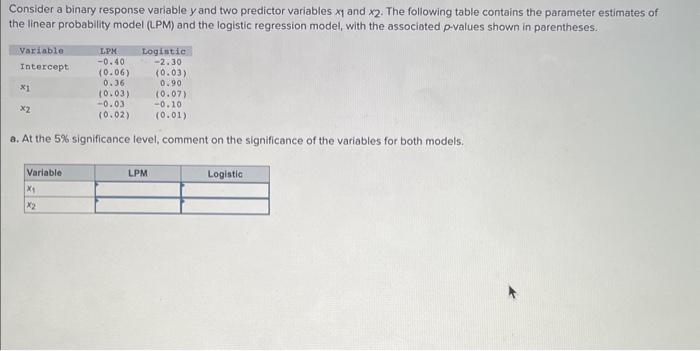

Transcribed Image Text:Consider a binary response variable y and two predictor variables x₁ and x2. The following table contains the parameter estimates of
the linear probability model (LPM) and the logistic regression model, with the associated p-values shown in parentheses.
Variable
Intercept
x1
x2
(0.07)
-0.10
(0.02) (0.01)
a. At the 5% significance level, comment on the significance of the variables for both models.
Variable
LPM
-0.40
(0.06)
0.36
X₁
X₂
(0.03)
-0.03
Logistic
-2.30
(0.03)
0.90
LPM
Logistic

Transcribed Image Text:b. What is the predicted probability implied by the linear probability model for x1 = 6 with x2 equal to 17 and 29?
Note: Round intermediate calculations to at least 4 decimal places and final answers to 2 decimal places. Report the probability
between 0 and 1 (not in %).
X₁ = 6, x₂ = 17
x₁=6, x₂=29
c. What is the predicted probability implied by the logistic model for x₁ = 6 with x2 equal to 17 and 29?
Note: Round intermediate calculations to at least 4 decimal places and final answers to 2 decimal places. Report the probability
between 0 and 1 (not in %).
x₁ = 6, X₂ = 17
= 6, x₂ = 29
9
x₁
9
Expert Solution
This question has been solved!
Explore an expertly crafted, step-by-step solution for a thorough understanding of key concepts.

This is a popular solution

Trending nowThis is a popular solution!

Step by stepSolved in 4 steps with 8 images

Knowledge Booster

Similar questions
- The following regression is fitted using variables identified that could be related to student requested loan amount, LOAN-AMT($) for returning students of a certain University. LOAN AMT = a + ß ACCEPT + y PREV + λ OUTS Where ACCEPT = the percentage of applicants that was accepted by the university, PREV= previous loan amount and OUTS outstanding loan amount The data was processed using MNITAB and the following is an extract of the output obtained: Predictor Constant ACCEPT PREV OUTS S = 2685 Coef -26780 116.00 -4.21 70.85 R-Sq = 69.6% Analysis of Variance DF 3 Source Regression Residual Error 49 Total 52 SS EXHIBIT 2 St Dev 6115 37.17 14.12 15.77 808139371 353193051 1161332421 a) What is dependent and independent variables? b) Fully write out the regression equation T * 3.14 -0.30 4.49 MS 269379790 7208021 c) What is the sample size used in this investigation? d) Fill in the blanks identified by *** and ****. e) Is ẞ significant, at the 5% level of significance? P 0.000 0.003 ** 0.000…arrow_forwardCalculate the estimate of σε What is the estimated resting heart rate for someone who is a smoker (Smoke=1) and exercises 1 hour a day (Exercise=1)?arrow_forwardAssume that you have collected a sample of observations from over 100 households and their consumption and income patterns. Using these observations, you estimate the following regression C₁ = Bo + B₁Y₁+H₁, where C is consumption and Y is disposable income. The estimate of B₁ will tell you: AIncome O A. APredicted Consumption OB. APredicted Consumption AIncome OC. Predicted Consumption Income OD. The amount you need to consume to survive.arrow_forward
- Bxi + €i, where €; are independently and Consider a simple linear regression model Y; = identically distributed with mean 0 and variance o?, and i = 1,..., n. Note: this model does not have a intercept term. Derive the Best Linear Unbiased Estimator (BLUE) for B. Denote this by BBLUE. Make sure to state why this is the BLUE.arrow_forwardConsider the following correlations -0.9 , -0.5 , -0.2 , 0 , 0.2 , 0.5 and 0.9. For each give the fraction of the variation in y that is explained by the least-squares regression of y on x.arrow_forwardThe following table shows both current and projected data on the number, in millions, of Facebook users in a certain country. t = years since 2012 F = number of Facebookusers (millions) 0 9.7 1 10.5 2 10.8 3 12.2 4 13.1 5 13.2 6 13.8 (a) Plot the data. (b) Find the equation of the regression line. (Round regression line parameters to two decimal places.) F(t) = Add the graph of the regression line to the plot from part (a). (c) Explain in practical terms the meaning of the slope of the regression line. (Round your answers to two decimal places). The slope of the regression line is million users per year. The slope means that, from 2012 on, the number of Facebook users in the country is expected to increase by million each year.arrow_forward
- Can gender, educational level, and age predict the odds that someone votes for a particular candidate in the election? Over 1500 voters were selected, and data were col-lected on the highest year of school completed, their age, and their gender. We wish to t a logistic regression model: log(1 p p ) = 0 + 1Age + 2Education + 3Gender, where p is the binomial probability that a person voted for candidate Johnson, and gender is coded as the indicator for female. The R output is given below. parameter df estimate s.e z p-value (Intercept) 1 .1119 .3481 .321 .748 Age 1 .0020 .0032 .613 .54 Education 1 -.0100 .0184 .547 .585 Gender 1 .4282 .1040 4.117 .000 Null deviance: 255.95 on 1499 degrees of freedom Residual deviance: 220.80 on 1496 degrees of freedom Write down the tted logistic regression and give a short summary about the data analysis . Calculate the probability of voting for Johnson for a…arrow_forwardIn a study investigating maternal risk factors for congenital syphilis, syphilis is treated as a binary outcome variable, where 1 represents the presence of disease in a newborn and 0 represents absence of disease. The estimated coefficients from a logistic regression model containing the predictors cocaine or crack use, marital status, number of prenatal visits to a doctor, alcohol use and level of education are included in the table below. The estimated intercept is not included in the table. a. As an expectant mother’s number of prenatal visits to the doctor increases, does the probability that her child will be born with congenital syphilis increase or decrease?b. Marital status is a binary variable, where 1 indicates that a woman is unmarried and 0 indicates that she is married. What are the estimated relative odds that a newborn will suffer from syphilis for unmarried versus married mothers after holding the other variables in the model constant?c. Cocaine or crack use is also a…arrow_forwardA professor has found that scores on the midterm exam in her classes predict scores on the final exam. The regression constant in the linear prediction rule for predicting final exam scores from midterm exam scores is 31 and the regression coefficient is 0.5. Complete parts (a) through (k) below. (a) Indicate the predictor variable.arrow_forward
- The following table gives the sales of CD_Rom drives and compact disk players for selected years and can be found in Glassman. Sales are in millions. Year 1988 1990 1992 1993 Sales 0.075 0.24 1.5 4.8 A. On the basis of this data, find the best-fitting exponential regression. Let x = 0 correspond to 1988. State the square of the correlation coefficient. (Use 4 decimal places in you answers.)S(x) = r2 = B. Use this model the estimate the sales in 1997. (Round to the nearest player.)In 1997, there were about million CD_ROM and compact disk players sold.arrow_forwardThe following table gives the sales of CD_Rom drives and compact disk players for selected years and can be found in Glassman. Sales are in millions. Year 1988 1990 1992 1993 Sales 0.075 0.24 1.5 4.8 A. On the basis of this data, find the best-fitting exponential regression. Let x = 0 correspond to 1988. State the square of the correlation coefficient. (Use 4 decimal places in you answers.) S(x) = r2 = B. Use this model the estimate the sales in 1997. (Round to the nearest player.) In 1997, there were about million CD_ROM and compact disk players sold.arrow_forward
arrow_back_ios
arrow_forward_ios
Recommended textbooks for you
- MATLAB: An Introduction with ApplicationsStatisticsISBN:9781119256830Author:Amos GilatPublisher:John Wiley & Sons Inc
 Probability and Statistics for Engineering and th...StatisticsISBN:9781305251809Author:Jay L. DevorePublisher:Cengage Learning
 Statistics for The Behavioral Sciences (MindTap C...StatisticsISBN:9781305504912Author:Frederick J Gravetter, Larry B. WallnauPublisher:Cengage Learning
  Elementary Statistics: Picturing the World (7th E...StatisticsISBN:9780134683416Author:Ron Larson, Betsy FarberPublisher:PEARSON
 The Basic Practice of StatisticsStatisticsISBN:9781319042578Author:David S. Moore, William I. Notz, Michael A. FlignerPublisher:W. H. Freeman
 Introduction to the Practice of StatisticsStatisticsISBN:9781319013387Author:David S. Moore, George P. McCabe, Bruce A. CraigPublisher:W. H. Freeman
MATLAB: An Introduction with Applications
Statistics
ISBN:9781119256830
Author:Amos Gilat
Publisher:John Wiley & Sons Inc
Probability and Statistics for Engineering and th...
Statistics
ISBN:9781305251809
Author:Jay L. Devore
Publisher:Cengage Learning
Statistics for The Behavioral Sciences (MindTap C...
Statistics
ISBN:9781305504912
Author:Frederick J Gravetter, Larry B. Wallnau
Publisher:Cengage Learning
Elementary Statistics: Picturing the World (7th E...
Statistics
ISBN:9780134683416
Author:Ron Larson, Betsy Farber
Publisher:PEARSON
The Basic Practice of Statistics
Statistics
ISBN:9781319042578
Author:David S. Moore, William I. Notz, Michael A. Fligner
Publisher:W. H. Freeman
Introduction to the Practice of Statistics
Statistics
ISBN:9781319013387
Author:David S. Moore, George P. McCabe, Bruce A. Craig
Publisher:W. H. Freeman