Consider a hypothetical economy in which households spend $0.80 of each additional dollar they earn and save the remaining $0.20. The following graph shows the economy's initial aggregate demand eurve (AD1). Suppose the government increases its purchases by $1 billion. After the multiplier effect, the increase in government purchases will cause the quantity of output demanded to increase by $5.00 billion at each price level. Place the green line (triangle symbol) on the following graph to show the aggregate demand curve (AD2) after the multiplier effect takes place. Be sure the new aggregate demand curve (AD2) is parallel to AD1. Hover your'mouse over the AD1 curve to see its slope. 116 AD2
Consider a hypothetical economy in which households spend $0.80 of each additional dollar they earn and save the remaining $0.20. The following graph shows the economy's initial aggregate demand eurve (AD1). Suppose the government increases its purchases by $1 billion. After the multiplier effect, the increase in government purchases will cause the quantity of output demanded to increase by $5.00 billion at each price level. Place the green line (triangle symbol) on the following graph to show the aggregate demand curve (AD2) after the multiplier effect takes place. Be sure the new aggregate demand curve (AD2) is parallel to AD1. Hover your'mouse over the AD1 curve to see its slope. 116 AD2

Chapter1: Making Economics Decisions
Section: Chapter Questions
Problem 1QTC

Related questions
Question
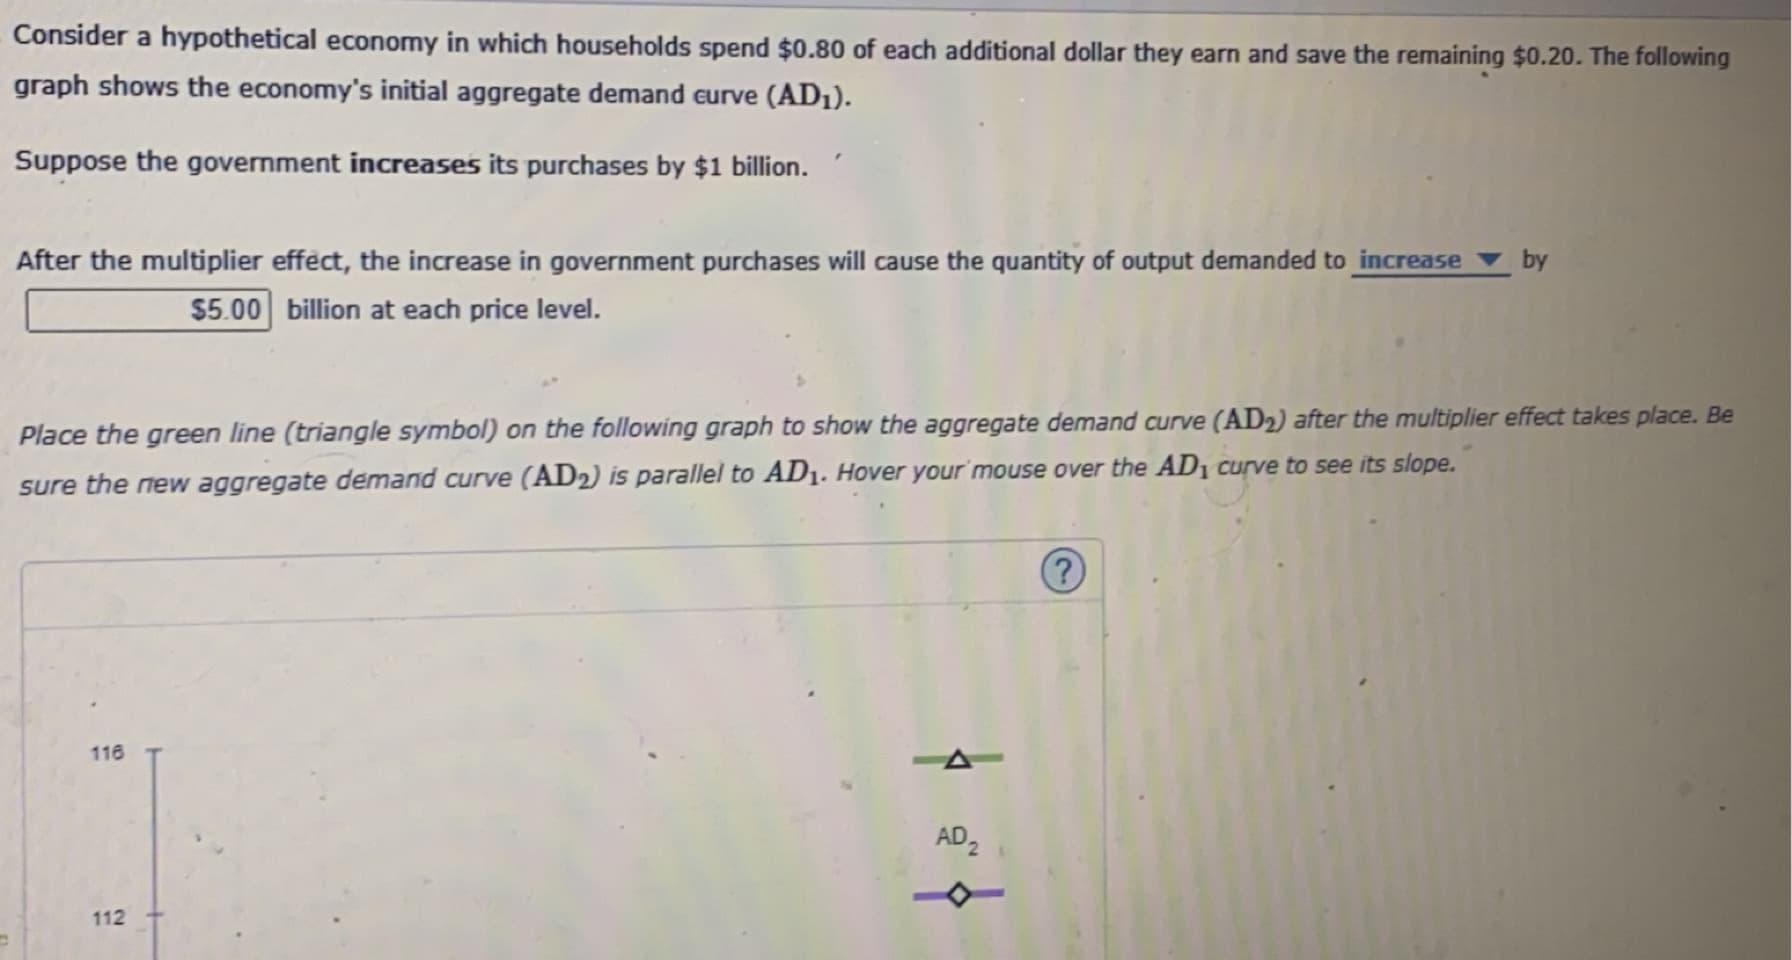
Transcribed Image Text:Consider a hypothetical economy in which households spend $0.80 of each additional dollar they earn and save the remaining $0.20. The following
graph shows the economy's initial aggregate demand eurve (AD1).
Suppose the government increases its purchases by $1 billion.
After the multiplier effect, the increase in government purchases will cause the quantity of output demanded to increase by
$5.00 billion at each price level.
Place the green line (triangle symbol) on the following graph to show the aggregate demand curve (AD2) after the multiplier effect takes place. Be
sure the new aggregate demand curve (AD2) is parallel to AD1. Hover your'mouse over the AD1 curve to see its slope.
116
AD2

Expert Solution
This question has been solved!
Explore an expertly crafted, step-by-step solution for a thorough understanding of key concepts.

This is a popular solution!

Trending now
This is a popular solution!

Step by step
Solved in 2 steps with 1 images

Knowledge Booster


Learn more about
Need a deep-dive on the concept behind this application? Look no further. Learn more about this topic, economics and related others by exploring similar questions and additional content below.Recommended textbooks for you

Principles of Economics (12th Edition)
Economics
ISBN:
9780134078779
Author:
Karl E. Case, Ray C. Fair, Sharon E. Oster
Publisher:
PEARSON

Engineering Economy (17th Edition)
Economics
ISBN:
9780134870069
Author:
William G. Sullivan, Elin M. Wicks, C. Patrick Koelling
Publisher:
PEARSON
Principles of Economics (12th Edition)
Economics
ISBN:
9780134078779
Author:
Karl E. Case, Ray C. Fair, Sharon E. Oster
Publisher:
PEARSON
Engineering Economy (17th Edition)
Economics
ISBN:
9780134870069
Author:
William G. Sullivan, Elin M. Wicks, C. Patrick Koelling
Publisher:
PEARSON

Principles of Economics (MindTap Course List)
Economics
ISBN:
9781305585126
Author:
N. Gregory Mankiw
Publisher:
Cengage Learning

Managerial Economics: A Problem Solving Approach
Economics
ISBN:
9781337106665
Author:
Luke M. Froeb, Brian T. McCann, Michael R. Ward, Mike Shor
Publisher:
Cengage Learning

Managerial Economics & Business Strategy (Mcgraw-…
Economics
ISBN:
9781259290619
Author:
Michael Baye, Jeff Prince
Publisher:
McGraw-Hill Education