Consider the following actual (A) and forecast (F) demand levels for a commercial multiline telephone at Office Max: Time Period (t) Actual Demand (A) Forecast Demand (F) 1 60 60 42 60 58 54.60 4. 46 55.62 The first forecast, F1, was derived by observing A1. and setting F1, equal to A1. Subsequent forecasts were derived by exponential smoothing. What would be the smoothing constant (a) used to derive the subsequent forecasts? (round your response to two decimal
Consider the following actual (A) and forecast (F) demand levels for a commercial multiline telephone at Office Max: Time Period (t) Actual Demand (A) Forecast Demand (F) 1 60 60 42 60 58 54.60 4. 46 55.62 The first forecast, F1, was derived by observing A1. and setting F1, equal to A1. Subsequent forecasts were derived by exponential smoothing. What would be the smoothing constant (a) used to derive the subsequent forecasts? (round your response to two decimal

Managerial Economics: Applications, Strategies and Tactics (MindTap Course List)
14th Edition
ISBN:9781305506381
Author:James R. McGuigan, R. Charles Moyer, Frederick H.deB. Harris
Publisher:James R. McGuigan, R. Charles Moyer, Frederick H.deB. Harris
Chapter5: Business And Economic Forecasting
Section: Chapter Questions
Problem 8E: Bell Greenhouses has estimated its monthly demand for potting soil to be the following: N=400+4X...

Related questions
Question
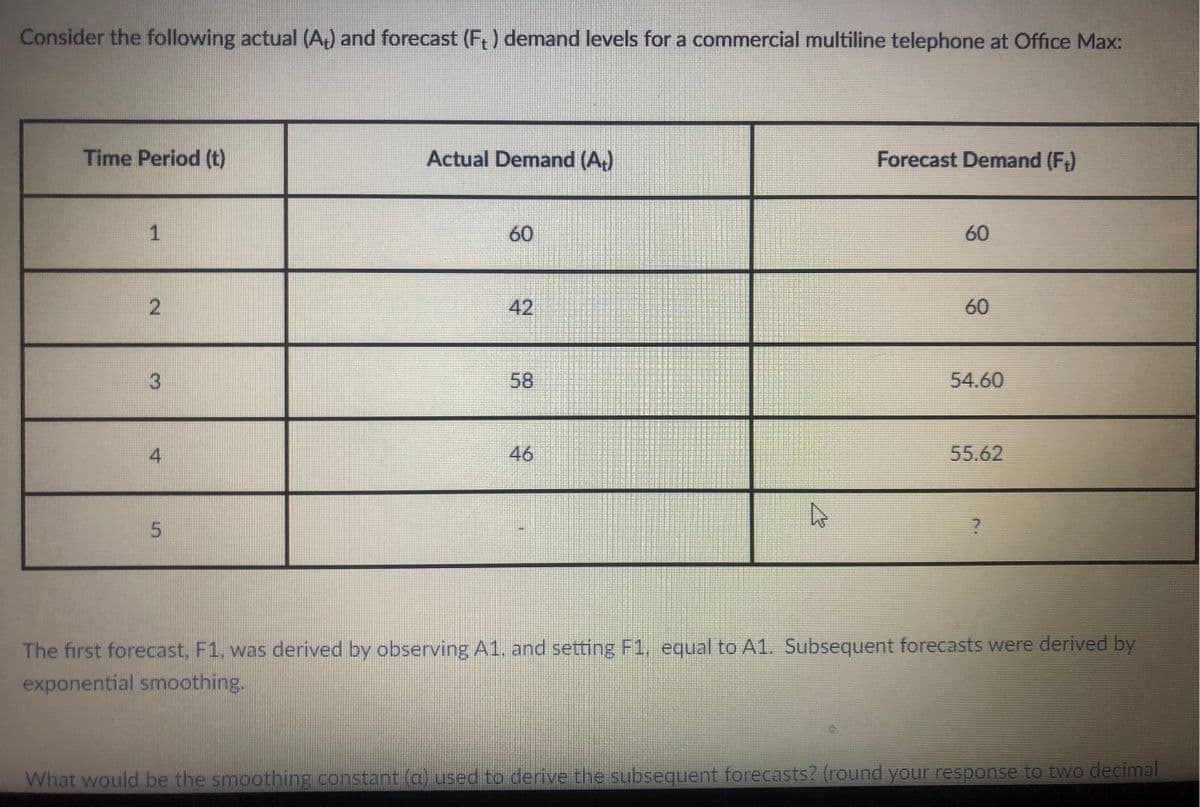
Transcribed Image Text:Consider the following actual (A) and forecast (F) demand levels for a commercial multiline telephone at Office Max:
Time Period (t)
Actual Demand (A)
Forecast Demand (F)
60
60
42
60
3
58
54.60
4
46
55.62
The first forecast, F1, was derived by observing A1, and setting F1, equal to A1. Subsequent forecasts were derived by
exponential smoothing.
What would be the smoothing constant (a) used to derive the subsequent forecasts? (round your response to two decimal
2.
Expert Solution
This question has been solved!
Explore an expertly crafted, step-by-step solution for a thorough understanding of key concepts.

This is a popular solution!

Trending now
This is a popular solution!

Step by step
Solved in 2 steps

Knowledge Booster


Learn more about
Need a deep-dive on the concept behind this application? Look no further. Learn more about this topic, economics and related others by exploring similar questions and additional content below.Recommended textbooks for you
Managerial Economics: Applications, Strategies an…
Economics
ISBN:
9781305506381
Author:
James R. McGuigan, R. Charles Moyer, Frederick H.deB. Harris
Publisher:
Cengage Learning
Managerial Economics: Applications, Strategies an…
Economics
ISBN:
9781305506381
Author:
James R. McGuigan, R. Charles Moyer, Frederick H.deB. Harris
Publisher:
Cengage Learning