
MATLAB: An Introduction with Applications
6th Edition
ISBN: 9781119256830
Author: Amos Gilat
Publisher: John Wiley & Sons Inc
expand_more
expand_more
format_list_bulleted
Related questions
Question
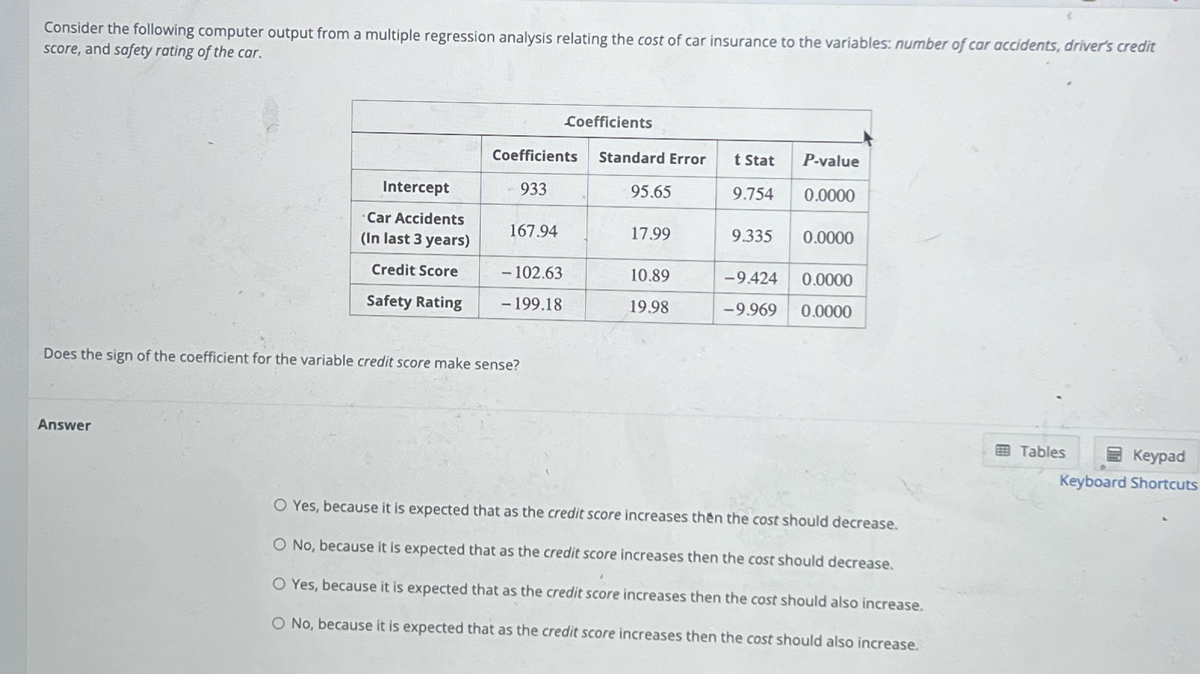

Transcribed Image Text:This image presents the output from a multiple regression analysis examining how the cost of car insurance is related to several variables: the number of car accidents in the last three years, the driver's credit score, and the safety rating of the car. The results are displayed in the following table:
**Coefficients Table:**
| | Coefficients | Standard Error | t Stat | P-value |
|----------------------|--------------|----------------|--------|---------|
| Intercept | 933 | 95.65 | 9.754 | 0.0000 |
| Car Accidents | 167.94 | 17.99 | 9.335 | 0.0000 |
| Credit Score | -102.63 | 10.89 | -9.424 | 0.0000 |
| Safety Rating | -199.18 | 19.98 | -9.969 | 0.0000 |
**Analysis:**
- **Intercept:** The intercept has a coefficient of 933, indicating the baseline cost of insurance when other variables are zero. The p-value suggests significant statistical relevance.
- **Car Accidents:** Each additional accident increases the insurance cost by 167.94. The t-stat and p-value signify strong significance.
- **Credit Score:** A higher credit score, by one unit, decreases the cost by 102.63. This coefficient's negative value has statistical significance.
- **Safety Rating:** A unit increase in safety rating reduces the cost by 199.18, demonstrating significant influence.
**Question:**
Does the sign of the coefficient for the variable credit score make sense?
**Answer Options:**
- Yes, because it is expected that as the credit score increases then the cost should decrease.
- No, because it is expected that as the credit score increases then the cost should decrease.
- Yes, because it is expected that as the credit score increases then the cost should also increase.
- No, because it is expected that as the credit score increases then the cost should also increase.
Expert Solution
This question has been solved!
Explore an expertly crafted, step-by-step solution for a thorough understanding of key concepts.

Step by stepSolved in 3 steps

Knowledge Booster

Similar questions
- Listed below are the overhead widths (cm) of seals measured from photographs and weights (kg) of the seals. Find the regression equation, letting the overhead width be the predictor (x) variable. Find the best predicted weight of a seal if the overhead width measured from a photograph is 1.8 cm, using the regression equation. Can the prediction be correct? If not, what is wrong? Use a significance level of 0.05. Overhead Width (cm) 7.3 7.4 9.8 9.5 8.8 8.5 Weight (kg) 152 187 286 247 237 231 The regression equation is y =+ (x. (Round the y-intercept to the nearest integer as needed. Round the slope to one decimal place as needed.)arrow_forwardGive an example of how a nonrepresentative sample can severely affect a regression analysis.arrow_forwardYou believe that the price of Zoom Videoconferencing stock and the price of American Airlines stock will move in opposite directions. In order to test this relationship, we do a simple regression with the following variables:A - dependent variable : month end price of American Airlines stockZ - independent variable: month end price of Zoom Videoconferencing stock Data from April 2019 through December 2020 (21 observations) is availableBased on the data, we compute the following:Var (Z) = 20927.702Cov (A,Z) = -899.153E(A) = 20.790E(Z) = 187.530Std Error of Estimate = 6.088TSS = 1476.830 Consider the equation At = b0 + b1 Zt + εtBased on the numbers given above, complete the following table Variable Estimate Std error t-statistic Slope b1 .00941 Constant b0 2.2088 R-square N/A N/A F statistic N/A N/A Are the coefficients (slope and/or constant) significant at the .05 level?arrow_forward
- Describe the correlation coefficient and explain how it is used in regression analysis?arrow_forwardCan you please check my workarrow_forwardThe data show the number of viewers for television stars with certain salaries. Find the regression equation, letting salary be the independent (x) variable. Find the best predicted number of viewers for a television star with a salary of $6 million. Is the result close to the actual number of viewers, 8.9 million? Use a significance level of 0.05. Salary (millions of $) Viewers (millions) Click the icon to view the critical values of the Pearson correlation coefficient r. 98 3.5 3 7 13 12 13 10 2 6.8 6.3 10.2 8.5 4.4 1.8 2.7 What is the regression equation? y=+x (Round to three decimal places as needed.) What is the best predicted number of viewers for a television star with a salary of $6 million? The best predicted number of viewers for a television star with a salary of $6 million is million. (Round to one decimal place as needed.) Is the result close to the actual number of viewers, 8.9 million? O A. The result is very close to the actual number of viewers of 8.9 million. O B. The…arrow_forward
arrow_back_ios
arrow_forward_ios
Recommended textbooks for you
- MATLAB: An Introduction with ApplicationsStatisticsISBN:9781119256830Author:Amos GilatPublisher:John Wiley & Sons Inc
 Probability and Statistics for Engineering and th...StatisticsISBN:9781305251809Author:Jay L. DevorePublisher:Cengage Learning
 Statistics for The Behavioral Sciences (MindTap C...StatisticsISBN:9781305504912Author:Frederick J Gravetter, Larry B. WallnauPublisher:Cengage Learning
  Elementary Statistics: Picturing the World (7th E...StatisticsISBN:9780134683416Author:Ron Larson, Betsy FarberPublisher:PEARSON
 The Basic Practice of StatisticsStatisticsISBN:9781319042578Author:David S. Moore, William I. Notz, Michael A. FlignerPublisher:W. H. Freeman
 Introduction to the Practice of StatisticsStatisticsISBN:9781319013387Author:David S. Moore, George P. McCabe, Bruce A. CraigPublisher:W. H. Freeman
MATLAB: An Introduction with Applications
Statistics
ISBN:9781119256830
Author:Amos Gilat
Publisher:John Wiley & Sons Inc
Probability and Statistics for Engineering and th...
Statistics
ISBN:9781305251809
Author:Jay L. Devore
Publisher:Cengage Learning
Statistics for The Behavioral Sciences (MindTap C...
Statistics
ISBN:9781305504912
Author:Frederick J Gravetter, Larry B. Wallnau
Publisher:Cengage Learning
Elementary Statistics: Picturing the World (7th E...
Statistics
ISBN:9780134683416
Author:Ron Larson, Betsy Farber
Publisher:PEARSON
The Basic Practice of Statistics
Statistics
ISBN:9781319042578
Author:David S. Moore, William I. Notz, Michael A. Fligner
Publisher:W. H. Freeman
Introduction to the Practice of Statistics
Statistics
ISBN:9781319013387
Author:David S. Moore, George P. McCabe, Bruce A. Craig
Publisher:W. H. Freeman