
MATLAB: An Introduction with Applications
6th Edition
ISBN: 9781119256830
Author: Amos Gilat
Publisher: John Wiley & Sons Inc
expand_more
expand_more
format_list_bulleted
Related questions
Question
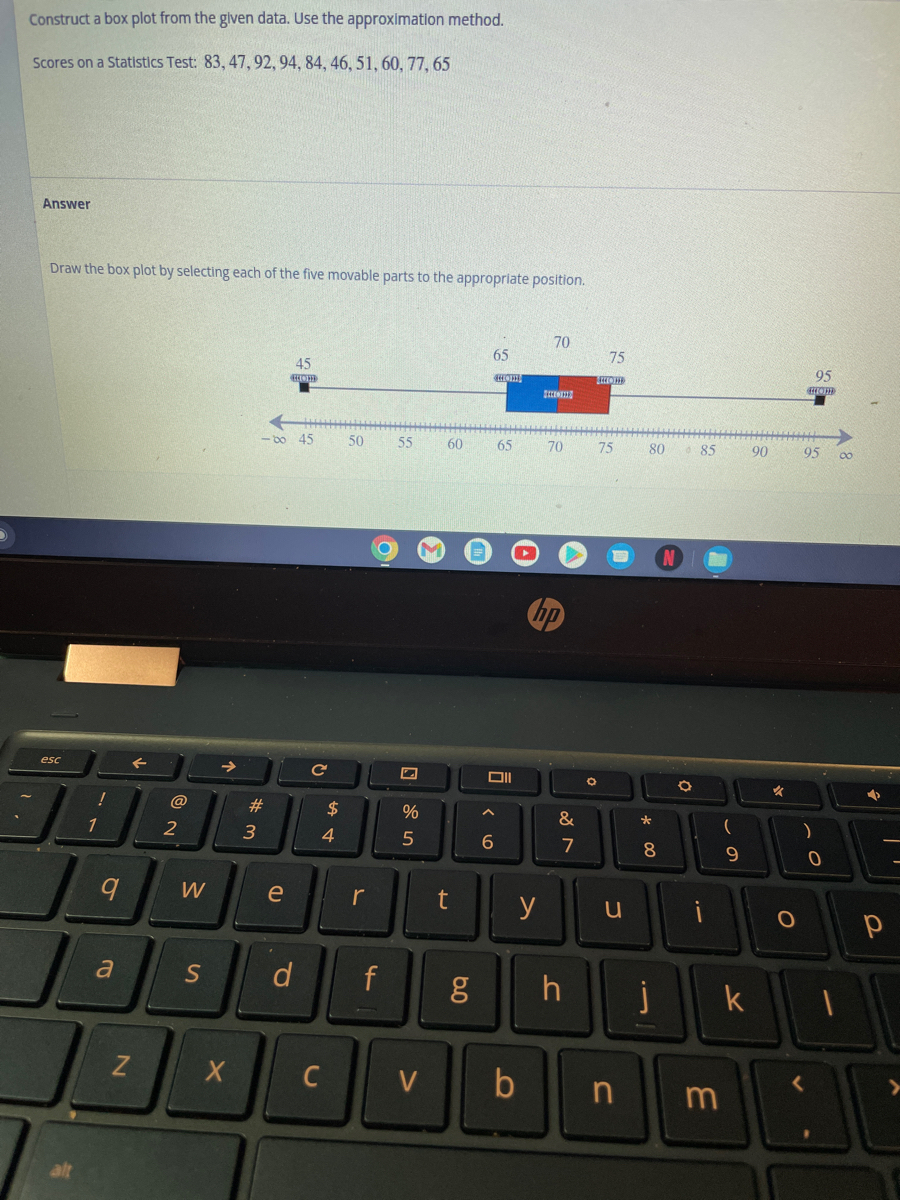

Transcribed Image Text:Construct a box plot from the given data. Use the approximation method.
Scores on a Statistics Test: 83, 47, 92, 94, 84, 46, 51, 60, 77, 65
Answer
Draw the box plot by selecting each of the five movable parts to the appropriate position.
esc
alt
!
1
9
a
N
←
@
2
W
X
#
3
88 45
45
CHHOD
e
S d
C
$
4
C
50
r
f
55
%
S
5
V
60
t
6.0
g
65
CHECH
65
Oll
6
y
b
70
SELECTI
70
hp
&
7
75
SECON
75
u
80
n
*
8
h j
85
i
m
(
9
k
90
✓
95
CHHORE
95 80
)
<
0
→
р
Expert Solution
This question has been solved!
Explore an expertly crafted, step-by-step solution for a thorough understanding of key concepts.

This is a popular solution

Trending nowThis is a popular solution!

Step by stepSolved in 3 steps with 1 images

Knowledge Booster

Similar questions
- Please answer the questions in the photo. TY! Both screenshots are for the same questionarrow_forwardUse the magnitudes (Richter scale) of the earthquakes listed in the data set below. Find the mean and median of this data set. Is the magnitude of an earthquake measuring 7.0 on the Richter scale an outlier (data value that is very far away from the others) when considered in the context of the sample data given in this data set? Explain. a. Find the mean and median of the data set using a calculator or similar data analysis technology. The mean of the data set is (Round to three decimal places as needed.) b. The median of the data set is (Round to three decimal places as needed.)arrow_forwardDetermine the median and mode from the histogram.arrow_forward
- Can someone please help? Thank you.arrow_forwardThe midterm and final exam grades for a statistics course are provided in the data set below. Jaymes, a student in the class, scored 86 on both exams. Treat the given data sets as samples. Midterm: 80, 78, 85, 82, 79, 79, 78, 86, 80, 84, 78, 84, 80, 84, 81, 78, 81, 82, 78, 84 Final: 81, 88, 68, 69, 69 81, 82, 86, 76, 71, 72, 68, 77, 86, 68, 83, 84, 71, 81, 87 z-score for midterm: 1.857 z-score for final: 1.181 Based on the z-scores calculated above, which of Jaymes's grades is more unusual, the midterm grade or the final exam grade? Select the correct answer below: A. The absolute value of the z-score for the final exam grade is greater than for the midterm grade, so the final exam grade is more unusual. B. The absolute value of the z-score for the midterm exam grade is less than for the final grade, so the midterm grade is more unusual. C. The absolute value of the z-score for the midterm exam grade is greater than for the final grade, so the midterm grade is more…arrow_forwardStaddlad 1. Find the mean, median, and mode of the following data: 26, 52, 37, 22, 24, 45, 58, 28, 39, 60, 25, 47, 23, 56, 28arrow_forward
- 8. Construct a box plot for the following data by finding the min, Q1, median, Q3, the max, and the IQR. 59, 50, 65, 68, 72, 80, 82arrow_forwardThe median for the set of sample measurement { -10,-8,-4,-2,0,6,11} a. -2 b. -1 c. 0 d. 6arrow_forwardThe following data are the grades of 18 students on an algebra test. 77,74,56,55,85,58,88,71,86,94,63,61,89,61,57,85,93 construct a box-and-whisker plot for the data.arrow_forward
- A car dealership records the number of cars sold each day over a week: 20, 25, 18, 22, 26, 19, and 21. Calculate the mean, median, and mode of the number of cars sold per day.arrow_forwardWhen computing the variance using a sample of size n = 30, we divide the sum of squared deviations by Give your answer as a whole number.arrow_forwardCalculate the mean and median of the following grades on a math test: 88, 80, 80, 77, 76, 75, 73, 72, 66, 64, 61 Mean = Median = Is this data set skewed to the right, symmetric, or skewed to the left?arrow_forward
arrow_back_ios
SEE MORE QUESTIONS
arrow_forward_ios
Recommended textbooks for you
- MATLAB: An Introduction with ApplicationsStatisticsISBN:9781119256830Author:Amos GilatPublisher:John Wiley & Sons Inc
 Probability and Statistics for Engineering and th...StatisticsISBN:9781305251809Author:Jay L. DevorePublisher:Cengage Learning
 Statistics for The Behavioral Sciences (MindTap C...StatisticsISBN:9781305504912Author:Frederick J Gravetter, Larry B. WallnauPublisher:Cengage Learning
  Elementary Statistics: Picturing the World (7th E...StatisticsISBN:9780134683416Author:Ron Larson, Betsy FarberPublisher:PEARSON
 The Basic Practice of StatisticsStatisticsISBN:9781319042578Author:David S. Moore, William I. Notz, Michael A. FlignerPublisher:W. H. Freeman
 Introduction to the Practice of StatisticsStatisticsISBN:9781319013387Author:David S. Moore, George P. McCabe, Bruce A. CraigPublisher:W. H. Freeman
MATLAB: An Introduction with Applications
Statistics
ISBN:9781119256830
Author:Amos Gilat
Publisher:John Wiley & Sons Inc
Probability and Statistics for Engineering and th...
Statistics
ISBN:9781305251809
Author:Jay L. Devore
Publisher:Cengage Learning
Statistics for The Behavioral Sciences (MindTap C...
Statistics
ISBN:9781305504912
Author:Frederick J Gravetter, Larry B. Wallnau
Publisher:Cengage Learning
Elementary Statistics: Picturing the World (7th E...
Statistics
ISBN:9780134683416
Author:Ron Larson, Betsy Farber
Publisher:PEARSON
The Basic Practice of Statistics
Statistics
ISBN:9781319042578
Author:David S. Moore, William I. Notz, Michael A. Fligner
Publisher:W. H. Freeman
Introduction to the Practice of Statistics
Statistics
ISBN:9781319013387
Author:David S. Moore, George P. McCabe, Bruce A. Craig
Publisher:W. H. Freeman