Consumer Reports tested 19 different brands and models of road, fitness, and comfort bikes. Road bikes are designed for long road trips; fitness bikes are designed for regular workouts or daily commuters; and comfort bikes are designed for leisure rides on typically flat roads. The data file Bikes show the type, weight (lb.), and price ($) for the 20 bicycles tested. In Minitab, Develop an estimated regression equation that can be used to predict Price by using Type and Weight. At the 0.05 level of significance, test for autocorrelation in the data. Bikes: Brand and Model Type Weight Price Klein Rêve v Road 20 1800 Giant OCR Composite 3 Road 22 1800 Giant OCR 1 Road 22 1000 Specialized Roubaix Road 21 1300 Trek Pilot 2.1 Road 21 1320 Cannondale Synapse 4 Road 21 1050 LeMond Poprad Road 22 1350 Raleigh Cadent 1.0 Road 24 650 Giant FCR3 Fitness 23 630 Schwinn Super Sport GS Fitness 23 700 Fuji Absolute 2.0 Fitness 24 700 Jamis Coda Comp Fitness 26 830 Cannondale Road Warrior 400 Fitness 25 700 Schwinn Sierra GS Comfort 31 340 Mongoose Switchback SX Comfort 32 280 Giant Sedona DX Comfort 32 360 Jamis Explorer 4.0 Comfort 35 600 Diamondback Wildwood Deluxe Comfort 34 350 Specialized Crossroads Sport Comfort 31 330 Jamis Coda Comp Comfort 33 500 Please paste the Minitab output.


Correlation
Correlation defines a relationship between two independent variables. It tells the degree to which variables move in relation to each other. When two sets of data are related to each other, there is a correlation between them.
Linear Correlation
A correlation is used to determine the relationships between numerical and categorical variables. In other words, it is an indicator of how things are connected to one another. The correlation analysis is the study of how variables are related.
Regression Analysis
Regression analysis is a statistical method in which it estimates the relationship between a dependent variable and one or more independent variable. In simple terms dependent variable is called as outcome variable and independent variable is called as predictors. Regression analysis is one of the methods to find the trends in data. The independent variable used in Regression analysis is named Predictor variable. It offers data of an associated dependent variable regarding a particular outcome.
- Consumer Reports tested 19 different brands and models of road, fitness, and comfort bikes. Road bikes are designed for long road trips; fitness bikes are designed for regular workouts or daily commuters; and comfort bikes are designed for leisure rides on typically flat roads. The data file Bikes show the type, weight (lb.), and price ($) for the 20 bicycles tested.
- In Minitab, Develop an estimated regression equation that can be used to predict Price by using Type and Weight.
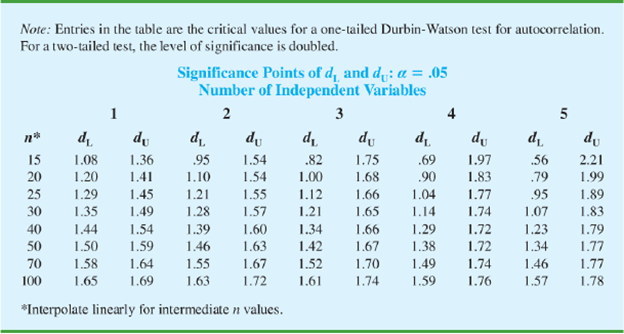
- At the 0.05 level of significance, test for autocorrelation in the data.
Bikes:
| Brand and Model | Type | Weight | Price |
| Klein Rêve v | Road | 20 | 1800 |
| Giant OCR Composite 3 | Road | 22 | 1800 |
| Giant OCR 1 | Road | 22 | 1000 |
| Specialized Roubaix | Road | 21 | 1300 |
| Trek Pilot 2.1 | Road | 21 | 1320 |
| Cannondale Synapse 4 | Road | 21 | 1050 |
| LeMond Poprad | Road | 22 | 1350 |
| Raleigh Cadent 1.0 | Road | 24 | 650 |
| Giant FCR3 | Fitness | 23 | 630 |
| Schwinn Super Sport GS | Fitness | 23 | 700 |
| Fuji Absolute 2.0 | Fitness | 24 | 700 |
| Jamis Coda Comp | Fitness | 26 | 830 |
| Cannondale Road Warrior 400 | Fitness | 25 | 700 |
| Schwinn Sierra GS | Comfort | 31 | 340 |
| Mongoose Switchback SX | Comfort | 32 | 280 |
| Giant Sedona DX | Comfort | 32 | 360 |
| Jamis Explorer 4.0 | Comfort | 35 | 600 |
| Diamondback Wildwood Deluxe | Comfort | 34 | 350 |
| Specialized Crossroads Sport | Comfort | 31 | 330 |
| Jamis Coda Comp | Comfort | 33 | 500 |
Please paste the Minitab output.


Trending now
This is a popular solution!

Step by step
Solved in 3 steps with 1 images


