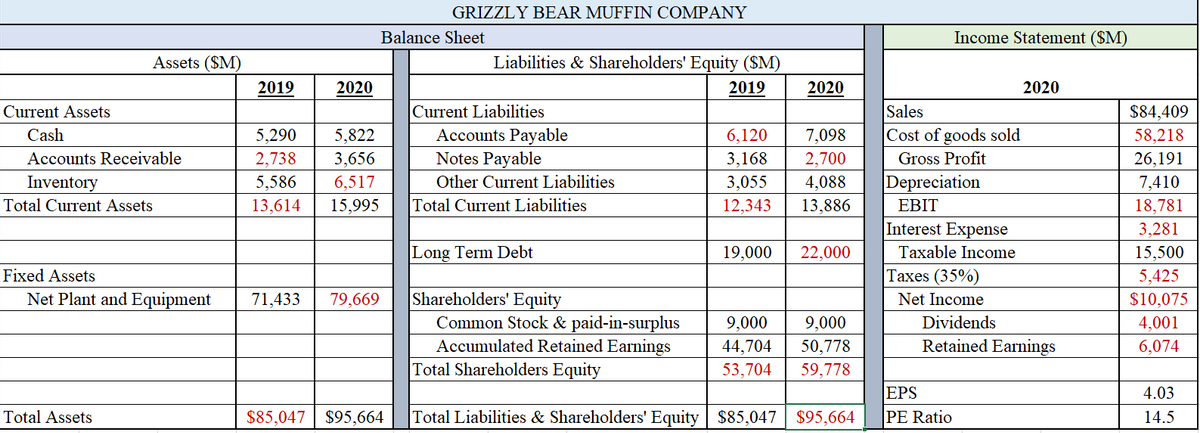
GRIZZLY BEAR MUFFIN COMPANY Balance Sheet Income Statement (SM) Assets ($M) Liabilities & Shareholders' Equity ($M) 2019 2020 2019 2020 2020 Current Liabilities Accounts Payable Notes Payable Sales |Cost of goods sold Gross Profit Current Assets $84,409 Cash 5,290 5,822 6,120 7,098 58,218 Accounts Receivable 2,738 3,656 3,168 2,700 26,191 Depreciation 7,410 18,781 Inventory 5,586 6,517 Other Current Liabilities 3,055 4,088 Total Current Assets 13,614 15,995 Total Current Liabilities 12,343 13,886 ЕBIT Interest Expense 3,281 |Long Term Debt 19,000 22,000 Taxable Income 15,500 Fixed Assets Net Plant and Equipment Taxes (35%) 5,425 Shareholders' Equity Common Stock & paid-in-surplus Accumulated Retained Earnings Total Shareholders Equity 71,433 79,669 Net Income $10,075 9,000 9,000 Dividends 4,001 44,704 50,778 Retained Earnings 6,074 53,704 59,778 EPS PE Ratio 4.03 Total Assets $85,047| $95,664 Total Liabilities & Shareholders' Equity $85,047 || $95,664 14.5

Cornerstones of Financial Accounting
4th Edition
ISBN:9781337690881
Author:Jay Rich, Jeff Jones
Publisher:Jay Rich, Jeff Jones
Chapter9: Long-term Liabilities
Section: Chapter Questions
Problem 103.2C
icon
Related questions
Question
100%

Use information from the balance sheet and income statement to calculate the following financial ratios and the market value added (MVA).

(Whenever balance sheet numbers are used to calculate financial ratios, please ensure that you use the average of the 2019 and 2020 numbers in your calculation. To calculate MVA, you can assume that the average book value number for common stock and paid-in-surplus is the amount that the shareholders initially invested in the company.)


GRIZZLY BEAR MUFFIN COMPANY
Balance Sheet
Income Statement ($M)
Assets ($M)
Liabilities & Shareholders' Equity ($M)
2019
2020
2019
2020
2020
Current Assets
Cash
Current Liabilities
Accounts Payable
Notes Payable
Sales
$84,409
5,290
5,822
6,120
7,098
Cost of goods sold
58,218
26,191
Accounts Receivable
3,656
6,517
2,738
3,168
2,700
Gross Profit
Inventory
Total Current Assets
5,586
13,614
Other Current Liabilities
4,088
Depreciation
7,410
3,055
15,995
Total Current Liabilities
12,343
13,886
EBIT
18,781
Interest Expense
3,281
|Long Term Debt
19,000
22,000
Taxable Income
15,500
Fixed Assets
Taxes (35%)
5,425
$10,075
Shareholders' Equity
Common Stock & paid-in-surplus
Accumulated Retained Earnings
Total Shareholders Equity
Net Plant and Equipment
71,433
79,669
Net Income
9,000
9.000
Dividends
4,001
44,704
Retained Earnings
50,778
59,778
6,074
53,704
EPS
4.03
Total Assets
$85,047
$95,664
Total Liabilities & Shareholders' Equity | $85,047
$95,664
PE Ratio
14.5
Transcribed Image Text:GRIZZLY BEAR MUFFIN COMPANY Balance Sheet Income Statement ($M) Assets ($M) Liabilities & Shareholders' Equity ($M) 2019 2020 2019 2020 2020 Current Assets Cash Current Liabilities Accounts Payable Notes Payable Sales $84,409 5,290 5,822 6,120 7,098 Cost of goods sold 58,218 26,191 Accounts Receivable 3,656 6,517 2,738 3,168 2,700 Gross Profit Inventory Total Current Assets 5,586 13,614 Other Current Liabilities 4,088 Depreciation 7,410 3,055 15,995 Total Current Liabilities 12,343 13,886 EBIT 18,781 Interest Expense 3,281 |Long Term Debt 19,000 22,000 Taxable Income 15,500 Fixed Assets Taxes (35%) 5,425 $10,075 Shareholders' Equity Common Stock & paid-in-surplus Accumulated Retained Earnings Total Shareholders Equity Net Plant and Equipment 71,433 79,669 Net Income 9,000 9.000 Dividends 4,001 44,704 Retained Earnings 50,778 59,778 6,074 53,704 EPS 4.03 Total Assets $85,047 $95,664 Total Liabilities & Shareholders' Equity | $85,047 $95,664 PE Ratio 14.5
Short-term Solvency Ratios
Current Ratio
Quick Ratio
NWC to total assets
Asset Utilization Ratios
Days' sales in inventory
Receivables Turnover
Long-term Solvency Ratios
Equity Multiplier
Cash Coverage Ratio
Profitability Ratios
Profit Margin
Return on equity
Market Value Ratios
Market-to-book ratio
Market Value Added ($M)
Transcribed Image Text:Short-term Solvency Ratios Current Ratio Quick Ratio NWC to total assets Asset Utilization Ratios Days' sales in inventory Receivables Turnover Long-term Solvency Ratios Equity Multiplier Cash Coverage Ratio Profitability Ratios Profit Margin Return on equity Market Value Ratios Market-to-book ratio Market Value Added ($M)
Expert Solution
Step 1

Hi Student

Since there are multiple sub parts,we will answer only first three subparts. If you want remaining sub parts to be answered, then please resubmit the question and specify the sub parts that are to be answered.

trending now

Trending now

This is a popular solution!

steps

Step by step

Solved in 2 steps

Blurred answer
Follow-up Questions
Read through expert solutions to related follow-up questions below.
Follow-up Question

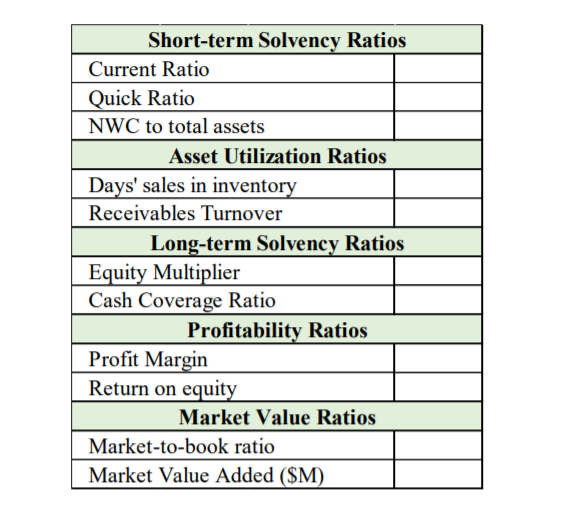
Please find: Cash Coverage Ratio, Profit Margin, Return on eq


Use information from the balance sheet and income statement to calculate the following financial ratios and the market value added (MVA).

(Whenever balance sheet numbers are used to calculate financial ratios, please ensure that you use the average of the 2019 and 2020 numbers in your calculation. To calculate MVA, you can assume that the average book value number for common stock and paid-in-surplus is the amount that the shareholders initially invested in the company.)

Current Assets
Cash
Accounts Receivable
Inventory
Assets (SM)
Total Current Assets
Fixed Assets
Net Plant and Equipment
Total Assets
2019
2020
GRIZZLY BEAR MUFFIN COMPANY
Balance Sheet
5,290
5,822
2,738
3,656
5,586
6,517
13,614 15,995
71,433 79,669
$85,047 $95,664
Liabilities & Shareholders' Equity (SM)
2019
Current Liabilities
Accounts Payable
Notes Payable
Other Current Liabilities
Total Current Liabilities.
2020
6,120
7,098
3.168
2,700
3,055 4,088
12,343 13,886
Long Term Debt
Shareholders' Equity
Common Stock & paid-in-surplus
Accumulated Retained Earnings
Total Shareholders Equity
Total Liabilities & Shareholders' Equity $85,047 $95,664
19,000 22,000
9,000 9,000
44,704 50,778
53,704 59,778
Income Statement (SM)
Sales
Cost of goods sold
Gross Profit
Depreciation
EBIT
Interest
Expense
Taxable Income
Taxes (35%)
Net Income
EPS
PE Ratio
2020
Dividends
Retained Earnings
$84,409
58,218
26,191
7,410
18,781
3,281
15,500
5,425
$10,075
4.001
6,074
4.03
14.5
Transcribed Image Text:Current Assets Cash Accounts Receivable Inventory Assets (SM) Total Current Assets Fixed Assets Net Plant and Equipment Total Assets 2019 2020 GRIZZLY BEAR MUFFIN COMPANY Balance Sheet 5,290 5,822 2,738 3,656 5,586 6,517 13,614 15,995 71,433 79,669 $85,047 $95,664 Liabilities & Shareholders' Equity (SM) 2019 Current Liabilities Accounts Payable Notes Payable Other Current Liabilities Total Current Liabilities. 2020 6,120 7,098 3.168 2,700 3,055 4,088 12,343 13,886 Long Term Debt Shareholders' Equity Common Stock & paid-in-surplus Accumulated Retained Earnings Total Shareholders Equity Total Liabilities & Shareholders' Equity $85,047 $95,664 19,000 22,000 9,000 9,000 44,704 50,778 53,704 59,778 Income Statement (SM) Sales Cost of goods sold Gross Profit Depreciation EBIT Interest Expense Taxable Income Taxes (35%) Net Income EPS PE Ratio 2020 Dividends Retained Earnings $84,409 58,218 26,191 7,410 18,781 3,281 15,500 5,425 $10,075 4.001 6,074 4.03 14.5
Short-term Solvency Ratios
Current Ratio
Quick Ratio
NWC to total assets
Asset Utilization Ratios
Days' sales in inventory
Receivables Turnover
Long-term Solvency Ratios
Equity Multiplier
Cash Coverage Ratio
Profitability Ratios
Profit Margin
Return on equity
Market Value Ratios
Market-to-book ratio
Market Value Added (SM)
Transcribed Image Text:Short-term Solvency Ratios Current Ratio Quick Ratio NWC to total assets Asset Utilization Ratios Days' sales in inventory Receivables Turnover Long-term Solvency Ratios Equity Multiplier Cash Coverage Ratio Profitability Ratios Profit Margin Return on equity Market Value Ratios Market-to-book ratio Market Value Added (SM)
Solution
Bartleby Expert
SEE SOLUTION
Follow-up Question

Please find: Days' sales in inventory, Receivables Turnover, Equity Multipli


Use information from the balance sheet and income statement to calculate the following financial ratios and the market value added (MVA).

(Whenever balance sheet numbers are used to calculate financial ratios, please ensure that you use the average of the 2019 and 2020 numbers in your calculation. To calculate MVA, you can assume that the average book value number for common stock and paid-in-surplus is the amount that the shareholders initially invested in the company.)

Short-term Solvency Ratios
Current Ratio
Quick Ratio
NWC to total assets
Asset Utilization Ratios
Days' sales in inventory
Receivables Turnover
Long-term Solvency Ratios
Equity Multiplier
Cash Coverage Ratio
Profitability Ratios
Profit Margin
Return on equity
Market Value Ratios
Market-to-book ratio
Market Value Added (SM)
Transcribed Image Text:Short-term Solvency Ratios Current Ratio Quick Ratio NWC to total assets Asset Utilization Ratios Days' sales in inventory Receivables Turnover Long-term Solvency Ratios Equity Multiplier Cash Coverage Ratio Profitability Ratios Profit Margin Return on equity Market Value Ratios Market-to-book ratio Market Value Added (SM)
Current Assets
Cash
Accounts Receivable
Inventory
Assets (SM)
Total Current Assets
Fixed Assets
Net Plant and Equipment
Total Assets
2019
2020
GRIZZLY BEAR MUFFIN COMPANY
Balance Sheet
5,290
5,822
2,738
3,656
5,586
6,517
13,614 15,995
71,433 79,669
$85,047 $95,664
Liabilities & Shareholders' Equity (SM)
2019
Current Liabilities
Accounts Payable
Notes Payable
Other Current Liabilities
Total Current Liabilities.
2020
6,120
7,098
3.168
2,700
3,055 4,088
12,343 13,886
Long Term Debt
Shareholders' Equity
Common Stock & paid-in-surplus
Accumulated Retained Earnings
Total Shareholders Equity
Total Liabilities & Shareholders' Equity $85,047 $95,664
19,000 22,000
9,000 9,000
44,704 50,778
53,704 59,778
Income Statement (SM)
Sales
Cost of goods sold
Gross Profit
Depreciation
EBIT
Interest
Expense
Taxable Income
Taxes (35%)
Net Income
EPS
PE Ratio
2020
Dividends
Retained Earnings
$84,409
58,218
26,191
7,410
18,781
3,281
15,500
5,425
$10,075
4.001
6,074
4.03
14.5
Transcribed Image Text:Current Assets Cash Accounts Receivable Inventory Assets (SM) Total Current Assets Fixed Assets Net Plant and Equipment Total Assets 2019 2020 GRIZZLY BEAR MUFFIN COMPANY Balance Sheet 5,290 5,822 2,738 3,656 5,586 6,517 13,614 15,995 71,433 79,669 $85,047 $95,664 Liabilities & Shareholders' Equity (SM) 2019 Current Liabilities Accounts Payable Notes Payable Other Current Liabilities Total Current Liabilities. 2020 6,120 7,098 3.168 2,700 3,055 4,088 12,343 13,886 Long Term Debt Shareholders' Equity Common Stock & paid-in-surplus Accumulated Retained Earnings Total Shareholders Equity Total Liabilities & Shareholders' Equity $85,047 $95,664 19,000 22,000 9,000 9,000 44,704 50,778 53,704 59,778 Income Statement (SM) Sales Cost of goods sold Gross Profit Depreciation EBIT Interest Expense Taxable Income Taxes (35%) Net Income EPS PE Ratio 2020 Dividends Retained Earnings $84,409 58,218 26,191 7,410 18,781 3,281 15,500 5,425 $10,075 4.001 6,074 4.03 14.5
Solution
Bartleby Expert
SEE SOLUTION
Knowledge Booster
Ratio Analysis
Learn more about
Need a deep-dive on the concept behind this application? Look no further. Learn more about this topic, accounting and related others by exploring similar questions and additional content below.
Similar questions
Recommended textbooks for you
Cornerstones of Financial Accounting
Accounting
ISBN:
9781337690881
Author:
Jay Rich, Jeff Jones
Publisher:
Cengage Learning
Survey of Accounting (Accounting I)
Accounting
ISBN:
9781305961883
Author:
Carl Warren
Publisher:
Cengage Learning
Financial And Managerial Accounting
Accounting
ISBN:
9781337902663
Author:
WARREN, Carl S.
Publisher:
Cengage Learning,
Intermediate Accounting: Reporting And Analysis
Accounting
ISBN:
9781337788281
Author:
James M. Wahlen, Jefferson P. Jones, Donald Pagach
Publisher:
Cengage Learning
Fundamentals Of Financial Management, Concise Edi…
Finance
ISBN:
9781337902571
Author:
Eugene F. Brigham, Joel F. Houston
Publisher:
Cengage Learning
College Accounting, Chapters 1-27 (New in Account…
Accounting
ISBN:
9781305666160
Author:
James A. Heintz, Robert W. Parry
Publisher:
Cengage Learning