Current Ratio of Three Leading Companies 3.00 2.50 |2.00 1.50 BHP RIO 1.00 FMG 0.50 0.00 2016 2017 2018 2019 2020 Years Current Ratio


Q: Complete the spreadsheet by calculating Gross Profit; Gross Profit Margin; ROE; D/E; Current Ratio;…
A: Note: Since we only answer up to 3 sub-parts, we’ll answer the first 3. Please resubmit the question…
Q: 1.Calculate the break‐even point for Pearson & Litt for 2019 and 2020. 2. Compare the results of…
A: Since you have posted a question with multiple sub-parts, we will solve the first three subparts for…
Q: You are provided with the Income Statement and the Balance Sheet of HTS software, Inc. for 2011.…
A: Formulae Current Ratio= Current assets/ Current Liabilities Quick ratio=…
Q: Following are financial statement numbers and ratios for Lockheed Martin Corp. for the year ended…
A: Solution:- Projected revenue means the expected revenue for the year after considering all the…
Q: Computing and Interpreting Financial Statement Ratios Following are selected ratios of Norfolk…
A: Ratio analysis means where different ratio of various years of years companies has been compared and…
Q: a) Calculate Earning per Share (EPS) under each of the three economic scenarios, before any debt is…
A: Information Provided; EBIT = $21,000 Marker value without debt = $165,000 Expansion = 25% higher…
Q: The trend analysis report of Doremon Ltd is given below: (in millions) 2020 2019 2018 2017 2016…
A: Trend analysis is a method of analyzing the financial statements. As per this method, one year is…
Q: You are preparing pro forma financial statements for 2017 using the percent-of-sales method. Sales…
A: Given that: Net Income in 2016 = $5000 Net Income in 2017 = $6000 Equity at the end of 2016 = $50000
Q: What is the comparison (analysis) of the Book Value Per Share of Industry Average Ratio and the…
A: Book value per share is the ratio which determines the book value of equity available to every…
Q: Computing and Interpreting Financial Statement Ratios Following are selected ratios of…
A: a. Yes, Colgate Palmolive was profitable in year 2015 as evidenced by its positive net profit margin…
Q: What is the comparison (analysis) of the Profit Margin of Industry Average Ratio and the Company A…
A: The Net Profit Margin: The Net Profit Margin or the Profit Margin is the proportion of sales that is…
Q: What is the comparison (analysis) of the Total Assets Turnover of Industry Average Ratio and the…
A: The Total Assets Turnover Ratio: The total assets turnover ratio is the ratio of net sales to the…
Q: Analyze the following ratios (Good/Not good, Undervalued/Overvalued, or just OK) based on the given…
A: Analyze the following ratios (Good/Not good, Undervalued/Overvalued, or just OK) based on the given…
Q: What is the comparison (analysis) of the Quick Ratio of Industry Average Ratio and the Company A…
A: Quick ratios is one of the liquidity ratios that helps the investors and the managers to analyze the…
Q: Compute the price-earnings ratio for each of these four separate companies. For which of these four…
A:
Q: 1. In financial statement analysis, what is the basic objective of observing trends in data and…
A: Financial statement analysis refers to the procedure of analyzing the financial statements of the…
Q: Question 2. Below are the operating income on sales ratios for three international companies: Year…
A: The question is related to Ratio Analysis. The operating income on sales is Net Profit Margin Ratio.…
Q: River Valley Production Inc. seeks to increase its market share and improve its results. The company…
A: Ratio Analysis is the financial analysis technique which is used to determine the liquidity,…
Q: Also, assess the relative profitability of the company (as benchmarked with competitors) using the…
A: Ratio Analysis The purpose of preparing the Ratio analysis is to know the financial strength of the…
Q: What is the comparison (analysis) of the ROA of Industry Average Ratio and the Company A Ratio? The…
A: ROA stands for the return on assets. This ratio shows the efficiency of the assets and the return…
Q: This is the operating margin from 2015 to 2019: 2015: 23.33% 2016: 15.69% 2017: 18.15% 2018: 25.06%…
A: Trend analysis is a process which is used to analyze the past movements so that the future trend can…
Q: Front Beam Lighting Company has the following ratios compared to its industry for 2008. Front…
A: Given information: Return on assets of Front Beam is 12% Return on assets of Industry is 5% Return…
Q: Total Liabilities Net Sales 1919570 35.6220 4.0160 3728490 428 1110 1707200 53.4920 150.3470 5.9100…
A: Return on equity is the financial measure that helps in determining the company’s performance. It…
Q: Category of industry is real estate. The analysis of Total Debt Ratio is as follows: 2015: 39.73%…
A: Ratio analysis is a tool used by the financial analyst to measure the financial performance of the…
Q: Calculation and interpretation of ratios. Data for White Star Limited: Net operating profit after…
A: Accounting ratios are those ratios which states the two lines of the financial statement of the…
Q: ee below table of Ratios for a company. Comment on the liquidity, profitability, leverage, asset…
A: Ratio analysis is an important tool of financial management. It provides the information about…
Q: Using the financial statements and using these ratios from the picture, discuss the performance of…
A: From an income statement, the figures like revenue, gross margin, operating income, and net income…
Q: Perform a Dupont Analysis for Dunder Mifflin, Inc. for 2015 and 2016 Hint: Use the Product(...)…
A: Ratio Analysis It is important for the business entity to calculate the required percentage of ratio…
Q: What is the comparison (analysis) of the Current Ratio of Industry Average Ratio and the Company A…
A: Current Ratio defines the performance of the company in terms of liquidity. Whether the current…
Q: Profitability ratios (1) What happened? Did each of the ratios increase, decrease, or not change?…
A: Since there are more than three multi-parts as per company policy it is possible only to solve 3 sub…
Q: What is the comparison (analysis) of the Equity Multiplier of Industry Average Ratio and the Company…
A: There are various methods that the company used in order to measures the risk one of them is the…
Q: 4.1.1 Gross margin 4.1.2 Inventory turnover 4.1.3 Acid test ratio
A: As per our protocol we provide solution to first three sub-parts only under a question but as you…
Q: Ratio 2010 2011 Industry 2011 Current Ratio 2.6 — 2.7…
A: Ratio analysis is used to examine a company's financial trend of outcomes over time. There are five…
Q: THE COMPANY'S FINANCIAL RATIO ANALYSIS a. Liquidity Ratio Liquidity Ratio: Year 2016 2017 2018 2019…
A: Disclaimer: “Since you have asked multiple questions, we will solve the first question for you. If…
Q: Make Analysis into an evaluation of the firm’s liquidity, activity, debt, profitability and market…
A: Ratio analysis: Ratio analysis can be defined as the qualitative method used for the purpose of…
Q: Long-term solvency refers to a company’s ability to pay its long-term obligations. Financing ratios…
A: (1)
Q: Solve the following ratios from year 2018-2020. Show complete solutions/computations. -CURRENT RATIO…
A: Current ratio is the ratio of Current assets to current liabilities. The current ratio is a…
Q: tions of ratios. one paragraph. 3A. Comparison between 2020E and 2019 ratios - (a) Liquidity…
A: Hello. Since your question has multiple sub-parts, we will solve first three sub-parts for you. If…
Q: Choose the correct letter of answer and provide a solution. Thanks The financial ratios of a firm…
A: Inventory is a form of current asset in the business, but this is not a liquid asset.
Q: What is the comparison (analysis) of the P/E Ratio of Industry Average Ratio and the Company A…
A: Meaning of Price to Earning Ratio or P/E Ratio: P/E Ratio is calculated as the price of share of a…
Q: What is the comparison (analysis) of the Total Debt Ratio of Industry Average Ratio and the Company…
A: in this problem we have to calculate average debt ratio of both industry and that of company.
Q: What is the comparison of Dividends Per Share between Alex Company and the industry Average? Which…
A: Dividend per share shows how much a company is paying the dividend for each share to its equity…
Q: Based on this analysis how would I assess the financial stability and operational efficiency of this…
A: Acid Test Ratio reflects a firm's balance sheet whether it has sufficient short-term assets to cover…
Q: performance of National Company. Comment on overall financial position and financial health of the…
A: The ratios which have problem are: 1. Inventory turnover 2. Net profit margin 3. Collection…
Q: What is the comparison of Earnings Per Share (EPS) between Alex Company and the industry Average?…
A: Earnings per share (EPS) refers to the financial indicator that evaluates the position of the…
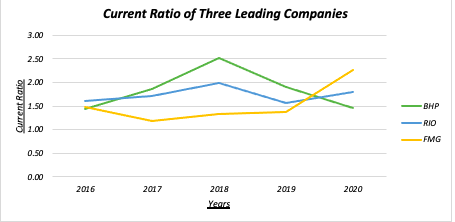
Does the information indicate whether the
|
Current Ratio |
|||||
|
|
2016 |
2017 |
2018 |
2019 |
2020 |
|
BHP |
1.44 |
1.85 |
2.51 |
1.89 |
1.45 |
|
RIO |
1.61 |
1.71 |
1.98 |
1.56 |
1.80 |
|
FMG |
1.48 |
1.18 |
1.33 |
1.37 |
2.25 |

Step by step
Solved in 2 steps

- If you are told that LSJ Company’s net income (12/31/2023) increased 55% when compared to net income (12/31/2022) …this would represent an example of what type of analysis: a. Vertical Analysis b. Horizontal Analysis c. Ratio AnalysisFind the average current ratio for the three following companies Current Ratio 2016 2017 2018 2019 2020 BHP 1.44 1.85 2.51 1.89 1.45 RIO 1.61 1.71 1.98 1.56 1.80 FMG 1.48 1.18 1.33 1.37 2.25Adams Inc. has the following data: rRF = 4.00%; RPM = 7.00%; and b = 1.20. What is the firm's cost of common from retained earnings based on the CAPM? Group of answer choices 11.53% 12.40% 12.03% 11.78% 12.65%
- using the table find the folloing for the four firms: Enterprise value to EBITDA Ratio Price-Earnings multiole PEG raio Cpmpany Market Value (OMR million) Net Income (OMR million) Earnings Growth Market Value of Equity (OMR million) Market Value of Debt (OMR million) Cash (OMR million) EBITDA (OMR million) Happy 117.95 22.5 4% 53.07 64.87 41.25 43.85 Smart 112.35 20.25 4.5% 59.53 52. 79 45 44.88 Kind 116.26 21 4.65% 69.76 46.5 63.95 28.20 Cheerful 120 24 5% 42 78 62.4 44.32Choose the correct letter of answer A firm has current liabilities and current ratio are P5,000.00 and 2.0, respectively. What is the total of its current assets? *a. P10,000.00b. P10,500.00c. P15,000.00d. P20,000.00e. P40,000.00Profitability ratios The following selected data were taken from the financial statements of Robinson Inc. for December 31, 2016, 2015 and 2014: December31 2016 2015 2014 Total assets......................................... 4,800,000 4,400,000 4,000,000 Notes payable (8% interest)........................... 2,250,000 2,250,000 2,250,000 Common stock...................................... 250,000 250,000 250,000 Preferred 4% stock, 100 par (no change during year)........................... 500,000 500,000 500,000 Retained earnings................................... 1,574,000 1,222,000 750,000 The 2016 net income was 372,000, and the 2015 net income was 492,000. No dividends on common stock were declared between 2014 and 2016. a. Determine the rate earned on total assets, the rate earned on stockholders equity, and the rate earned on common Stockholders equity for the years 2015 and 2016. Round to one decimal place. b. What conclusions can be drawn from these data as to the companys profitability?
- Current Asset 120 000Cash 20 000Accounts Receivable 45 000Short-term investments 12 000Merchandise Inventory 42 000Current Liabilities 68 000 What is the company's current ratio?What is the company's quick ratio?Compute for the price-earnings ratio if the earnings per share are Php 5.50: Market Value per share P.E Ratio 1 27.500 2 30.250 3 22.000 4 17.875 5 28.875O'Brien Inc. has the following data: rRF = 6.00%; RPM = 7.00%; and b = 1.40. What is the firm's cost of equity from retained earnings based on the CAPM? a. 14.42% b. 17.22% c. 11.86% d. 19.80% e. 17.09%
- The target company has sales of $2 million, net income of $1 million, and cash flows to equity of $1.1 million. The industry P/E ratio is 16.5. What is the valuation of the target company? Group of answer choices $18.15 million $33 million $16.5 million $10 millionChoose the correct letter of answer: Company C financial ratios are as follows: Current ratio: 1.6, Acid-test ratio 1.2, Current Liabilities P2 Million and Inventory turnover ratio 5. What is the sales of the firm? a. 1,000,000.00b. 2,000,000.00c. 3,000,000.00d. 4,000,000.00e. 5,000,000.00O'Brien Inc. has the following data: rRF = 5.00%; RPM = 6.00%; and b = 1.70. What is the firm's cost of equity from retained earnings based on the CAPM? 15.20% 15.05% 17.33% 13.68% 15.35%
