Solve the following ratios from year 2018-2020. Show complete solutions/computations. -CURRENT RATIO -QUICK RATIO -OPERATING MARGIN -PROFIT MARGIN - RETURN ON TOTAL ASSETS (ROA) - BASIC EARNINGS POWER -RETURN ON EQUITY (ROE) -INVENTORY TURNOVER RATIO -DAYS SALES
Solve the following ratios from year 2018-2020. Show complete solutions/computations. -CURRENT RATIO -QUICK RATIO -OPERATING MARGIN -PROFIT MARGIN - RETURN ON TOTAL ASSETS (ROA) - BASIC EARNINGS POWER -RETURN ON EQUITY (ROE) -INVENTORY TURNOVER RATIO -DAYS SALES

Chapter1: Financial Statements And Business Decisions
Section: Chapter Questions
Problem 1Q

Related questions
Question
1. Solve the following ratios from year 2018-2020. Show complete solutions/computations.
-CURRENT RATIO
-QUICK RATIO
-OPERATING MARGIN
-PROFIT MARGIN
- RETURN ON TOTAL ASSETS (ROA)
- BASIC EARNINGS POWER
-RETURN ON EQUITY (ROE)
-INVENTORY TURNOVER RATIO
-DAYS SALES OUTSTANDING
-FIXED ASSETS TURNOVER
-TOTAL ASSETS TURNOVER
-INVENTORY CONVERSION PERIOD
-TOTAL DEBT TO TOTAL ASSETS
-TOTAL DEBT TO TOTAL CAPITAL
-TIMES-INTEREST-EARNED RATIO
-EARNINGS PER SHARE
-PRICE EARNINGS RATIO
-MARKET BOOK VALUE RATIO
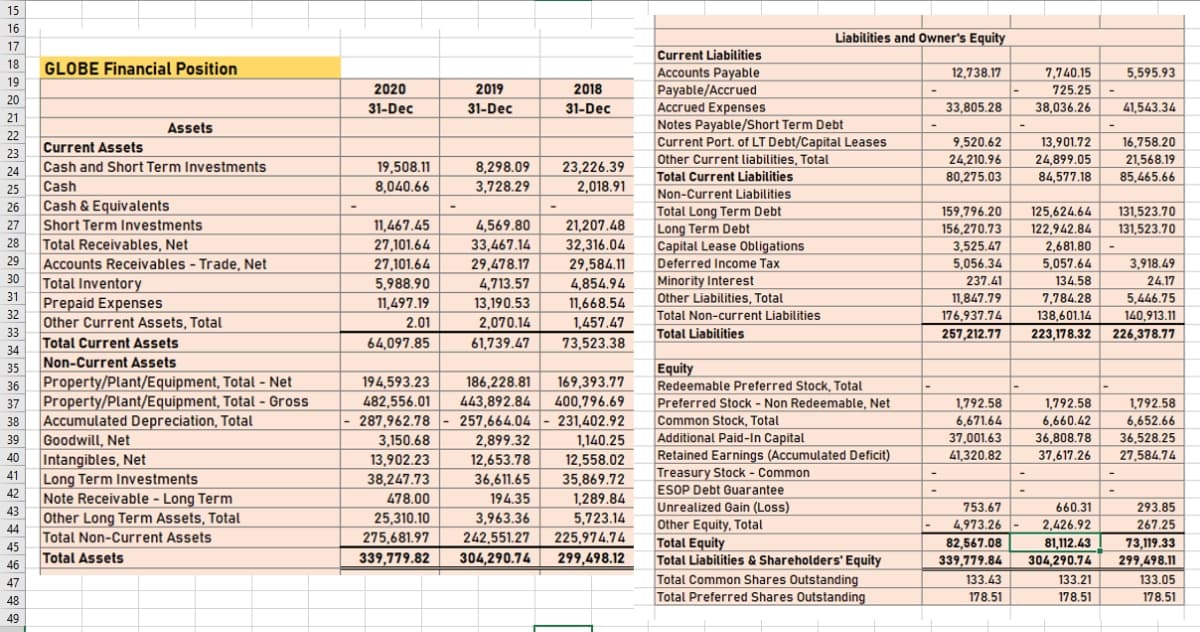
Transcribed Image Text:15
16
Liabilities and Owner's Equity
17
Current Liabilities
Accounts Payable
Payable/Accrued
Accrued Expenses
Notes Payable/Short Term Debt
Current Port. of LT Debt/Capital Leases
18
GLOBE Financial Position
7,740.15
725.25
12,738.17
5,595.93
19
2020
2019
2018
20
31-Dec
31-Dec
31-Dec
33.805.28
38,036.26
41.543.34
21
Assets
22
Current Assets
9,520.62
13,901.72
16,758.20
23
Cash and Short Term Investments
24,210.96
80,275.03
Other Current liabilities, Total
24,899.05
21,568.19
19,508.11
8,040.66
8,298.09
23,226.39
24
Total Current Liabilities
84,577.18
85,465.66
25
Cash
3,728.29
2,018.91
Cash & Equivalents
Short Term Investments
Total Receivables, Net
Non-Current Liabilities
Total Long Term Debt
Long Term Debt
26
159,796.20
125,624.64
131,523.70
27
11,467.45
4,569.80
21,207.48
156,270,73
122,942.84
131,523.70
33,467.14
29,478.17
28
2,681.80
5,057.64
27,101.64
32,316.04
29,584.11
3,525.47
Capital Lease Obligations
Deferred Income Tax
29
27,101.64
5,056.34
3,918.49
Accounts Receivables - Trade, Net
30
Total Inventory
5,988.90
4,713.57
Minority Interest
237.41
134.58
24.17
4,854.94
11,668.54
31
Prepaid Expenses
32
Other Current Assets, Total
33
Total Current Assets
34
11,497.19
13,190.53
Other Liabilities, Total
11,847.79
7,784.28
5,446.75
Total Non-current Liabilities
176,937,74
138,601.14
140,913.11
2.01
2,070.14
1,457.47
Total Liabilities
257,212.77
223,178.32
226,378.77
64,097.85
61,739.47
73,523.38
Non-Current Assets
Equity
Redeemable Preferred Stock, Total
35
Property/Plant/Equipment, Total - Net
Property/Plant/Equipment, Total - Gross
Accumulated Depreciation, Total
Goodwill, Net
Intangibles, Net
194,593.23
482,556.01
287,962.78
36
186,228.81
169,393.77
443,892.84
400,796.69
231,402.92
1,140.25
12,558.02
Preferred Stock - Non Redeemable, Net
Common Stock, Total
Additional Paid-In Capital
Retained Earnings (Accumulated Deficit)
Treasury Stock - Common
37
1,792.58
1.792,58
1,792,58
38
257,664.04
6,671.64
6,660.42
6,652.66
37,001.63
36,808.78
37,617.26
39
3,150.68
2,899.32
36,528.25
40
41,320.82
27,584.74
12,653.78
36,611.65
13,902.23
41
Long Term Investments
42
Note Receivable - Long Term
43
Other Long Term Assets, Total
44
Total Non-Current Assets
45
Total Assets
38,247.73
35,869.72
ESOP Debt Guarantee
1,289.84
5,723.14
225,974.74
478.00
194.35
Unrealized Gain (Loss)
Other Equity, Total
Total Equity
Total Liabilities & Shareholders' Equity
753.67
660.31
293.85
25,310.10
3,963.36
4,973.26
2,426.92
267.25
275,681.97
242,551.27
304,290.74
82,567.08
81,112.43
73,119.33
339,779.82
299,498.12
339,779.84
304,290.74
299,498.11
46
Total Common Shares Outstanding
Total Preferred Shares Outstanding
47
133,43
133.21
133.05
178.51
178.51
178.51
48
49
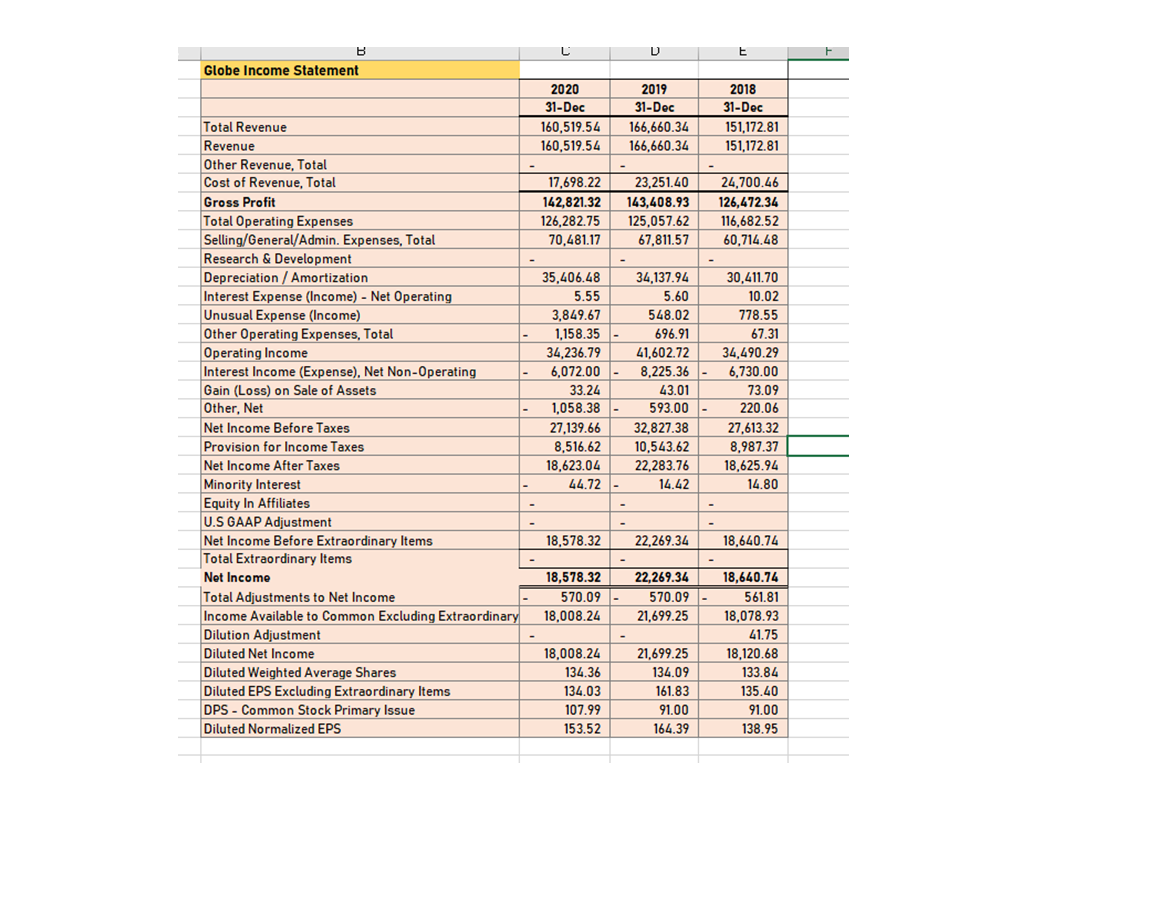
Transcribed Image Text:Globe Income Statement
2020
2019
2018
31-Doc
31-Doc
31-Dec
Total Revenue
Revenue
160,519.54
166,660.34
151,172.81
160,519.54
166,660.34
151,172.81
Other Revenue, Total
Cost of Revenue, Total
17,698.22
23,251.40
24,700,46
Gross Profit
142,821.32
143,408.93
126,472.34
Total Operating Expenses
Selling/General/Admin. Expenses, Total
Research & Development
Depreciation / Amortization
Interest Expense (Income) - Net Operating
Unusual Expense (Income)
Other Operating Expenses, Total
Operating Income
Interest Income (Expense), Net Non-Operating
126,282.75
125,057.62
116,682.52
70,481.17
67,811.57
60,714.48
35,406.48
34,137.94
30,411.70
5.55
5.60
10.02
3.849.67
548.02
778.55
1,158.35
696.91
67.31
41,602.72
34,490.29
34,236.79
6,072.00
8.225.36
6,730.00
Gain (Loss) on Sale of Assets
Other, Net
Net Income Before Taxes
43.01
593.00
33.24
73.09
1,058.38
220.06
27,139.66
8,516.62
18,623.04
32.827,38
27,613.32
Provision for Income Taxes
10,543.62
8,987.37
Net Income After Taxes
Minority Interest
Equity In Affiliates
U.S GAAP Adjustment
Net Income Before Extraordinary Items
Total Extraordinary Items
22.283.76
18,625.94
44.72
14.42
14.80
18,578.32
22,269.34
18,640.74
22,269.34
570.09
Net Income
18,578.32
18,640.74
570.09
Total Adjustments to Net Income
Income Available to Common Excluding Extraordinary
Dilution Adjustment
Diluted Net Income
561.81
18,008.24
21,699.25
18,078.93
41,75
18,008.24
21,699.25
18,120.68
Diluted Weighted Average Shares
Diluted EPS Excluding Extraordinary Items
DPS - Common Stock Primary Issue
134.36
134.09
133.84
134.03
161.83
135.40
107.99
91.00
91.00
Diluted Normalized EPS
153,52
164.39
138,95
Expert Solution
This question has been solved!
Explore an expertly crafted, step-by-step solution for a thorough understanding of key concepts.

Step by step
Solved in 7 steps

Knowledge Booster


Learn more about
Need a deep-dive on the concept behind this application? Look no further. Learn more about this topic, accounting and related others by exploring similar questions and additional content below.Recommended textbooks for you

Accounting
Accounting
ISBN:
9781337272094
Author:
WARREN, Carl S., Reeve, James M., Duchac, Jonathan E.
Publisher:
Cengage Learning,

Accounting Information Systems
Accounting
ISBN:
9781337619202
Author:
Hall, James A.
Publisher:
Cengage Learning,
Accounting
Accounting
ISBN:
9781337272094
Author:
WARREN, Carl S., Reeve, James M., Duchac, Jonathan E.
Publisher:
Cengage Learning,
Accounting Information Systems
Accounting
ISBN:
9781337619202
Author:
Hall, James A.
Publisher:
Cengage Learning,

Horngren's Cost Accounting: A Managerial Emphasis…
Accounting
ISBN:
9780134475585
Author:
Srikant M. Datar, Madhav V. Rajan
Publisher:
PEARSON

Intermediate Accounting
Accounting
ISBN:
9781259722660
Author:
J. David Spiceland, Mark W. Nelson, Wayne M Thomas
Publisher:
McGraw-Hill Education

Financial and Managerial Accounting
Accounting
ISBN:
9781259726705
Author:
John J Wild, Ken W. Shaw, Barbara Chiappetta Fundamental Accounting Principles
Publisher:
McGraw-Hill Education