Profitability ratios (1) What happened? Did each of the ratios increase, decrease, or not change? (2) What had caused the movement or non-movement for each ratio? and (3) Is this a good thing or a bad thing for the company?
Profitability ratios (1) What happened? Did each of the ratios increase, decrease, or not change? (2) What had caused the movement or non-movement for each ratio? and (3) Is this a good thing or a bad thing for the company?

Essentials Of Investments
11th Edition
ISBN:9781260013924
Author:Bodie, Zvi, Kane, Alex, MARCUS, Alan J.
Publisher:Bodie, Zvi, Kane, Alex, MARCUS, Alan J.
Chapter1: Investments: Background And Issues
Section: Chapter Questions
Problem 1PS

Related questions
Question
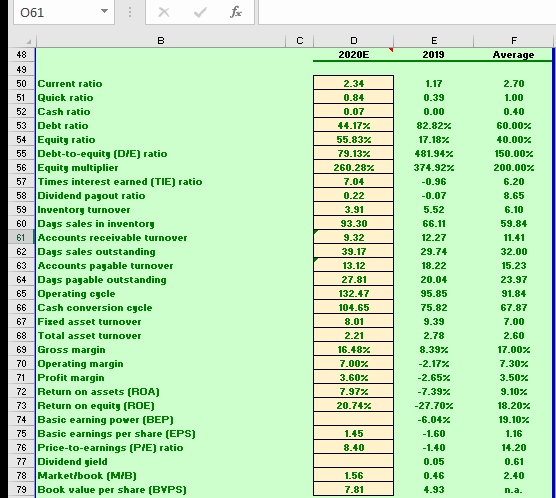
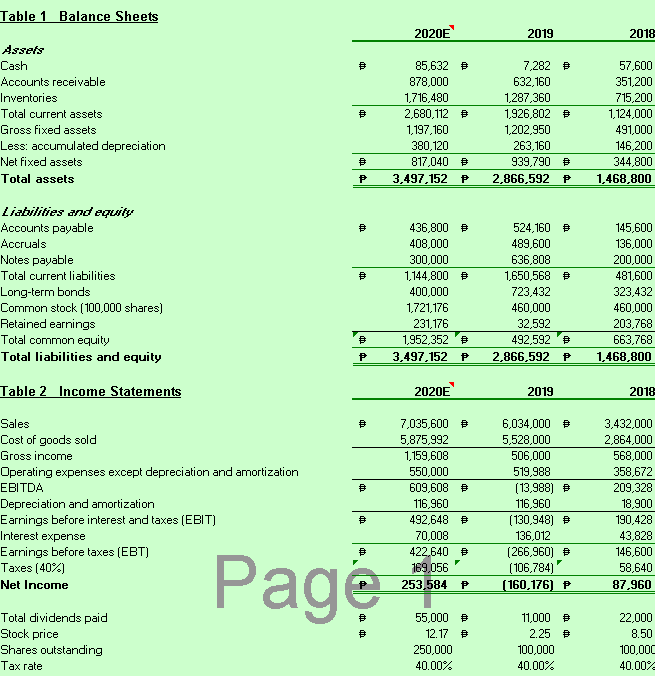
Compose a financial analysis based on your evaluation of the ratios. For EACH of the five (5) classifications of ratios. EXPLAIN IN ONE PARAGRAPH EACH.
3A. Comparison between 2020E and 2019 ratios -
(d) Profitability ratios
(1) What happened? Did each of the ratios increase, decrease, or not change?
(2) What had caused the movement or non-movement for each ratio? and
(3) Is this a good thing or a bad thing for the company?
(e) Market performance ratios)
(1) What happened? Did each of the ratios increase, decrease, or not change?
(2) What had caused the movement or non-movement for each ratio? and
(3) Is this a good thing or a bad thing for the company?
Transcribed Image Text:061
B
E
F
48
2020E
2019
Average
49
50 Current ratio
Quick ratio
52 Cash ratio
53 Debt ratio
54 Equity ratio
55 Debt-to-equity (D/E) ratio
56 Equity multiplier
Times interest earned (TIE) ratio
58 Dividend pagout ratio
59 Inventorg turnover
60 Days sales in inventorg
Accounts receivable turnover
62 Days sales outstanding
63 Accounts pagable turnover
64 Days pagable outstanding
65 Operating eyele
66 Cash conversion cycle
67 Fized asset turnover
68 Total asset turnover
69 Gross margin
70 Operating margin
Profit margin
72 Return on assets (ROA)
73 Return on equity (ROE)
74 Basic earning pover (BEP)
75 Basic earnings per share (EPS)
76 Price-to-earnings (PIE) ratio
77 Dividend gield
78 Market/book (MIB)
79 Book value per share (BYPS)
2.34
1.17
2.70
51
0.84
0.39
1.00
0.07
0.00
0.40
44.17%
55.83%
82.82%
60.00%
17.18%
40.00%
79.13%
481.94%
150.00%
260.28%
374.92%
200.00%
57
7.04
-0.96
6.20
0.22
-0.07
8.65
3.91
5.52
6.10
93.30
66.11
59.84
61
9.32
12.27
11.41
39.17
29.74
32.00
13.12
18.22
15.23
27.81
20.04
23.97
132.47
95.85
91.84
104.65
75.82
67.87
8.01
9.39
7.00
2.21
2.78
2.60
16.48%
8.39%
17.00%
7.00%
-2.17%
7.30%
71
3.60%
-2.65%
3.50%
7.97%
-7.39%
9.10%
20.74%
-27.70%
18.20%
-6.04%
19.10%
1.45
-1.60
1.16
8.40
-1.40
14.20
0.05
0.61
1.56
0.46
2.40
7.81
4.93
n.a.
Transcribed Image Text:Table 1 Balance Sheets
2020E
2019
2018-
Assets
Cash
85,632 B
7,282 B
57,600
Accounts receivable
878,000
632,160
351,200
Inventories
1,716,480
1,287,360
715,200
Total current assets
2,680,112 P
1,926,802 B
1,124,000
Gross fixed assets
1,197,160
1,202,950
491,000
Less: accumulated depreciation
Net fixed assets
380,120
263,160
146,200
817,040 B
939,790 B
344,800
Total assets
3,497.152 P
2,866,592 P
1,468,800
Liabilities and equity
Accounts payable
436,800 B
524,160 B
145,600
Accruals
408,000
489,600
136,000
Notes payable
300,000
636,808
200,000
481,600
323,432
Total current liabilities
1,144,800 B
1,650,568 B
Long-term bonds
Common stock (100,000 shares)
Retained earnings
Total common equity
400,000
723,432
1,721,176
460,000
460,000
231,176
32,592
203,768
1,952,352 D
492,592 e
663,768
Total liabilities and equity
P
3,497,152 P
2,866,592 P
1,468,800
Table 2 Income Statements
2020E
2019
2018-
Sales
7,035,600
6,034,000 B
3,432,000
Cost of goods sold
5,875,992
5,528,000
2,864,000
Gross income
1,159,608
506,000
568,000
Operating expenses except depreciation and amortization
550,000
519,988
358,672
EBITDA
609,608 B
(13,988) P
209,328
Depreciation and amortization
Earnings before interest and taxes (EBIT)
116,960
116,960
18,900
492,648 B
(130,948) P
190,428
Interest expense
70,008
136,012
43,828
422,640 B
Earnings before taxes (EBT)
Taxes (40%)
(266,960) P
(106,784)
(160,176) P
146,600
Page
169,056
58,640
Net Income
253,584 P
87,960
Total dividends paid
Stock price
55,000 B
11,000 B
22,000
12.17 D
2.25 B
8.50
Shares outstanding
250,000
100,000
100,000
Tax rate
40.00%
40.00%
40.00%
Expert Solution
This question has been solved!
Explore an expertly crafted, step-by-step solution for a thorough understanding of key concepts.

Step by step
Solved in 3 steps

Knowledge Booster


Learn more about
Need a deep-dive on the concept behind this application? Look no further. Learn more about this topic, finance and related others by exploring similar questions and additional content below.Recommended textbooks for you
Essentials Of Investments
Finance
ISBN:
9781260013924
Author:
Bodie, Zvi, Kane, Alex, MARCUS, Alan J.
Publisher:
Mcgraw-hill Education,


Essentials Of Investments
Finance
ISBN:
9781260013924
Author:
Bodie, Zvi, Kane, Alex, MARCUS, Alan J.
Publisher:
Mcgraw-hill Education,

Foundations Of Finance
Finance
ISBN:
9780134897264
Author:
KEOWN, Arthur J., Martin, John D., PETTY, J. William
Publisher:
Pearson,

Fundamentals of Financial Management (MindTap Cou…
Finance
ISBN:
9781337395250
Author:
Eugene F. Brigham, Joel F. Houston
Publisher:
Cengage Learning

Corporate Finance (The Mcgraw-hill/Irwin Series i…
Finance
ISBN:
9780077861759
Author:
Stephen A. Ross Franco Modigliani Professor of Financial Economics Professor, Randolph W Westerfield Robert R. Dockson Deans Chair in Bus. Admin., Jeffrey Jaffe, Bradford D Jordan Professor
Publisher:
McGraw-Hill Education