
MATLAB: An Introduction with Applications
6th Edition
ISBN: 9781119256830
Author: Amos Gilat
Publisher: John Wiley & Sons Inc
expand_more
expand_more
format_list_bulleted
Related questions
Question
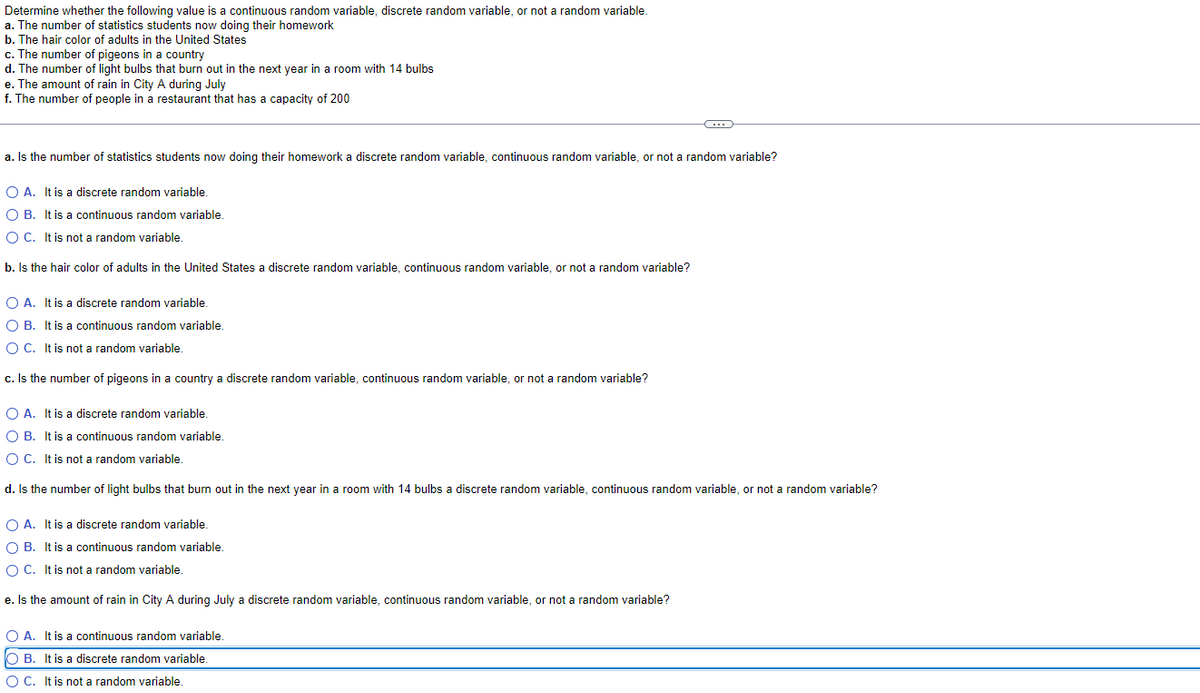

Transcribed Image Text:Determine whether the following value is a continuous random variable, discrete random variable, or not a random variable.
a. The number of statistics students now doing their homework
b. The hair color of adults in the United States
c. The number of pigeons in a country
d. The number of light bulbs that burn out in the next year in a room with 14 bulbs
e. The amount of rain in City A during July
f. The number of people in a restaurant that has a capacity of 200
a. Is the number of statistics students now doing their homework a discrete random variable, continuous random variable, or not a random variable?
O A. It is a discrete random variable.
O B. It is a continuous random variable.
O C. It is not a random variable.
b. Is the hair color of adults in the United States a discrete random variable, continuous random variable, or not a random variable?
O A. It is a discrete random variable.
O B. It is a continuous random variable.
O C. It is not a random variable.
c. Is the number of pigeons in a country a discrete random variable, continuous random variable, or not a random variable?
O A. It is a discrete random variable.
OB. It is a continuous random variable.
O C. It is not a random variable.
d. Is the number of light bulbs that burn out in the next year in a room with 14 bulbs a discrete random variable, continuous random variable, or not a random variable?
O A. It is a discrete random variable.
O B. It is a continuous random variable.
O C. It is not a random variable.
e. Is the amount of rain in City A during July a discrete random variable, continuous random variable, or not a random variable?
O A. It is a continuous random variable.
OB. It is a discrete random variable.
O C. It is not a random variable.
Expert Solution
This question has been solved!
Explore an expertly crafted, step-by-step solution for a thorough understanding of key concepts.

This is a popular solution

Trending nowThis is a popular solution!

Step by stepSolved in 2 steps

Knowledge Booster

Similar questions
- Suppose a random sample of 824 athletes from the college are asked what their major is. The table below shows the results of the survey. Observed Frequencies of Majors from the Sample Outcome Observed Frequency Math/Science 185 Arts & Humanities 206 Business & Economics 264 Other 169 The distribution of majors at the college is shown in the second column of the table below. Fill in the expected frequencies. (Round to the nearest whole number). Frequencies of Majors at the College Outcome Expected Percent Expected Frequency Math/Science 24 Arts & Humanities 22 Business & Economics 21 Other 33arrow_forwardIf you were to draw 15 random samples of 100 residents in a city you may get 15 different mean values simply by chance. These expected differences across samples may be defined as: a. a statistical effect b. sampling error c. random error d. probabilityarrow_forwardA violin student records the number of hours she spends practicing during each of nine consecutive weeks: 6.2 5.0 4.3 7.4 5.8 7.2 8.4 1.2 6.3 What is the mean number of hours spent practicing per week during this period? a. 6.20 hours b. 6.15 hours c. 8.40 hours d. 5.76 hoursarrow_forward
- K The population of ages at inauguration of all U.S. Presidents who had professions in the military is 62, 46, 68, 64, 57. Why does it not make sense to construct a histogram for this data set? Choose the correct answer below. O A. With a data set that is so small, the true nature of the distribution cannot be seen with a histogram. OB. There must be an even number of data values in the data set to create a histogram. OC. This data set would yield a histogram that is not bell-shaped. O D. Adequate class boundaries for a histogram cannot be found with this data set.arrow_forwardSee picture attachedarrow_forward3) What graphs can help us identify a normal distribution? a. Dotplot b. Histogram c. Boxplot d. Normal probability plot pick one a, b, c, d b, c a, b a, b, c b, darrow_forward
- 3. Can SAT scores predict college performance? Let x be a variable that represents SAT score of a computer science major, and let y be a variable that represents a student’s GPA upon graduation. A random sample of n =15 computer science majors provided their SAT scores and GPAs: x 1232 1070 1086 1287 1130 1048 1121 1095 1135 1208 1333 1160 1186 1243 1261 y 3.52 2.91 2.4 3.47 3.47 2.37 2.4 2.24 3.02 3.32 3.59 2.54 3.19 3.71 3.58 The scatter diagram for the SAT score and GPA is given below: (a) Find the sample correlation coefficient r. Truncate to two decimal places. What does the value tell you about the data? (b) Find the equation of the least squares line . Truncate to four decimal places. What does the slope mean? (c) Find the value of the coefficient of determination . Truncate to two decimal places. What does this number mean? (d) What is the predicted GPA if a computer science major got a…arrow_forwardThe data on the right represent the number of traffic fatalities by seat location and gender. Determine P(female) and P(female/driver). Are the events "female" and "driver" independent? Determine P(female). P(female) = (Round to three decimal places as needed.) Driver Male Female Total 32,738 11,842 44,580 Passenger 6,346 6,395 12,741 Total 39,084 18,237 57,321arrow_forward3. Can SAT scores predict college performance? Let x be a variable that represents SAT score of a computer science major, and let y be a variable that represents a student’s GPA upon graduation. A random sample of n =15 computer science majors provided their SAT scores and GPAs: x 1232 1070 1086 1287 1130 1048 1121 1095 1135 1208 1333 1160 1186 1243 1261 y 3.52 2.91 2.4 3.47 3.47 2.37 2.4 2.24 3.02 3.32 3.59 2.54 3.19 3.71 3.58 The scatter diagram for the SAT score and GPA is given below: (a) Find the sample correlation coefficient r. Truncate to two decimal places. What does the value tell you about the data? (b) Find the equation of the least squares line . Truncate to four decimal places. What does the slope mean? (c) Find the value of the coefficient of determination . Truncate to two decimal places. What does this number mean? (d) What is the predicted GPA if a computer science major got a…arrow_forward
- Determine whether each random variable is discrete or continuous. Answer only DISCRETE OR CONTINUOUS.a. The number of boys in a three-child family chosen at random.b. A cup of coffee served at a restaurant's temperature.c. The number of no-shows for every 100 commercial airline reservations.d. The number of automobiles owned by a household chosen at random.e. The average amount spent on electricity by a randomly selected household ineach state during the month of July.arrow_forwardSuppose a random sample of 800 athletes from the college are asked what their major is. The table below shows the results of the survey. Observed Frequencies of Majors from the Sample Observed Frequency Outcome Math/Science 256 Arts & Humanities 190 Business & Economics 153 Other 201 The distribution of majors at the college is shown in the second column of the table below. Fill in the expected frequencies. (Round to the nearest whole number). Frequencies of Majors at the College Expected Percent Outcome Expected Frequency Math/Science 18 Arts & Humanities 29 Business & Economics 25arrow_forwardA set of five different whole numbers are arranged in order from smallest to largest. The firstand last numbers are decreased by one. Which measure of spread for the set could thischange?a. The range. c. The standard deviation.b. The median. d) all of the abovearrow_forward
arrow_back_ios
SEE MORE QUESTIONS
arrow_forward_ios
Recommended textbooks for you
- MATLAB: An Introduction with ApplicationsStatisticsISBN:9781119256830Author:Amos GilatPublisher:John Wiley & Sons Inc
 Probability and Statistics for Engineering and th...StatisticsISBN:9781305251809Author:Jay L. DevorePublisher:Cengage Learning
 Statistics for The Behavioral Sciences (MindTap C...StatisticsISBN:9781305504912Author:Frederick J Gravetter, Larry B. WallnauPublisher:Cengage Learning
  Elementary Statistics: Picturing the World (7th E...StatisticsISBN:9780134683416Author:Ron Larson, Betsy FarberPublisher:PEARSON
 The Basic Practice of StatisticsStatisticsISBN:9781319042578Author:David S. Moore, William I. Notz, Michael A. FlignerPublisher:W. H. Freeman
 Introduction to the Practice of StatisticsStatisticsISBN:9781319013387Author:David S. Moore, George P. McCabe, Bruce A. CraigPublisher:W. H. Freeman
MATLAB: An Introduction with Applications
Statistics
ISBN:9781119256830
Author:Amos Gilat
Publisher:John Wiley & Sons Inc
Probability and Statistics for Engineering and th...
Statistics
ISBN:9781305251809
Author:Jay L. Devore
Publisher:Cengage Learning
Statistics for The Behavioral Sciences (MindTap C...
Statistics
ISBN:9781305504912
Author:Frederick J Gravetter, Larry B. Wallnau
Publisher:Cengage Learning
Elementary Statistics: Picturing the World (7th E...
Statistics
ISBN:9780134683416
Author:Ron Larson, Betsy Farber
Publisher:PEARSON
The Basic Practice of Statistics
Statistics
ISBN:9781319042578
Author:David S. Moore, William I. Notz, Michael A. Fligner
Publisher:W. H. Freeman
Introduction to the Practice of Statistics
Statistics
ISBN:9781319013387
Author:David S. Moore, George P. McCabe, Bruce A. Craig
Publisher:W. H. Freeman