ed on the analyst's data and regression line, complete the following. (a) For these data, values for earnings per share that are greater than the mean of the values for earnings per share tend to be paired with current stock prices that are (Choose one) v the mean of the current stock prices. (b) According to the regression equation, for an increase of one dollar in earnings per share, there is a corresponding increase of how many dollars in current stock price?
ed on the analyst's data and regression line, complete the following. (a) For these data, values for earnings per share that are greater than the mean of the values for earnings per share tend to be paired with current stock prices that are (Choose one) v the mean of the current stock prices. (b) According to the regression equation, for an increase of one dollar in earnings per share, there is a corresponding increase of how many dollars in current stock price?

Linear Algebra: A Modern Introduction
4th Edition
ISBN:9781285463247
Author:David Poole
Publisher:David Poole
Chapter7: Distance And Approximation
Section7.3: Least Squares Approximation
Problem 31EQ

Related questions
Question
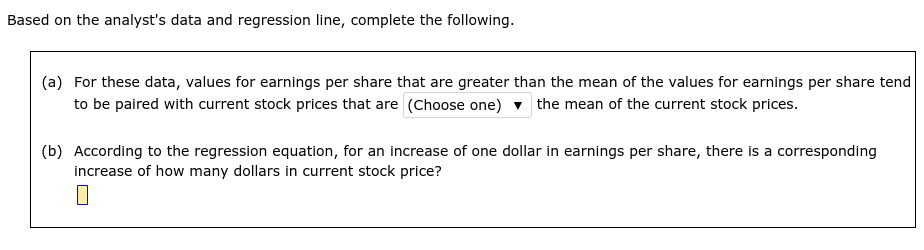
Transcribed Image Text:Based on the analyst's data and regression line, complete the following.
(a) For these data, values for earnings per share that are greater than the mean of the values for earnings per share tend
to be paired with current stock prices that are (Choose one) v the mean of the current stock prices.
(b) According to the regression equation, for an increase of one dollar in earnings per share, there is a corresponding
increase of how many dollars in current stock price?
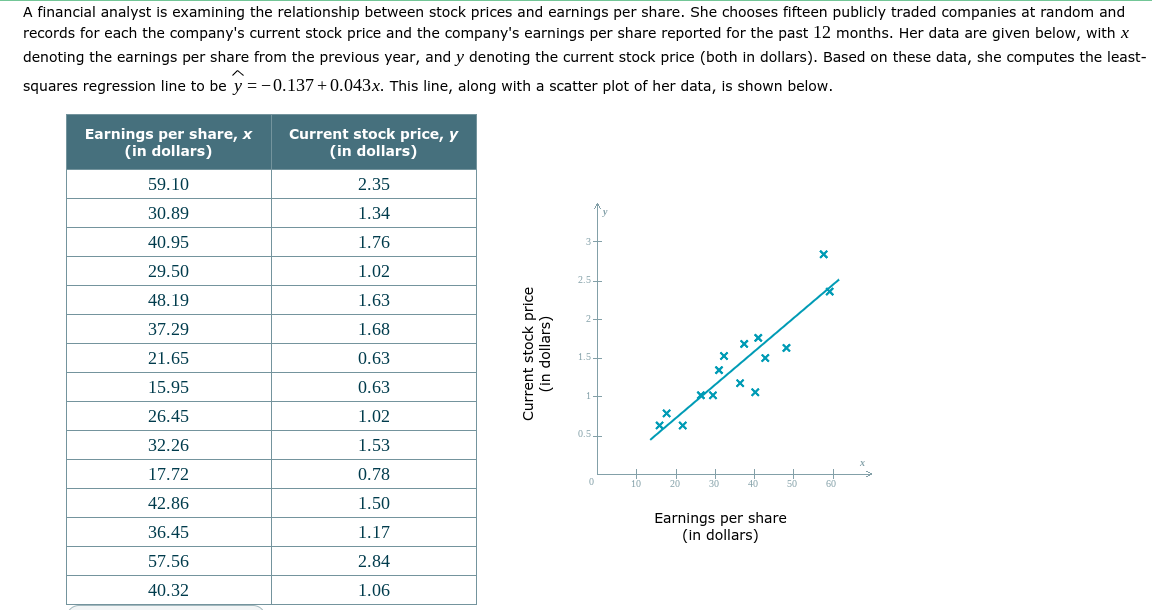
Transcribed Image Text:A financial analyst is examining the relationship between stock prices and earnings per share. She chooses fifteen publicly traded companies at random and
records for each the company's current stock price and the company's earnings per share reported for the past 12 months. Her data are given below, with x
denoting the earnings per share from the previous year, and y denoting the current stock price (both in dollars). Based on these data, she computes the least-
squares regression line to be y = -0.137 +0.043x. This line, along with a scatter plot of her data, is shown below.
Earnings per share, x
(in dollars)
Current stock price, y
(in dollars)
59.10
2.35
30.89
1.34
40.95
1.76
29.50
1.02
48.19
1.63
37.29
1.68
21.65
0.63
15.95
0.63
1-
26.45
1.02
0.5
32.26
1.53
17.72
0.78
42.86
1.50
Earnings per share
(in dollars)
36.45
1.17
57.56
2.84
40.32
1.06
Current stock price
(in dollars)
Expert Solution
This question has been solved!
Explore an expertly crafted, step-by-step solution for a thorough understanding of key concepts.

This is a popular solution!

Trending now
This is a popular solution!

Step by step
Solved in 2 steps with 2 images

Recommended textbooks for you
Linear Algebra: A Modern Introduction
Algebra
ISBN:
9781285463247
Author:
David Poole
Publisher:
Cengage Learning

Elementary Linear Algebra (MindTap Course List)
Algebra
ISBN:
9781305658004
Author:
Ron Larson
Publisher:
Cengage Learning
Linear Algebra: A Modern Introduction
Algebra
ISBN:
9781285463247
Author:
David Poole
Publisher:
Cengage Learning
Elementary Linear Algebra (MindTap Course List)
Algebra
ISBN:
9781305658004
Author:
Ron Larson
Publisher:
Cengage Learning