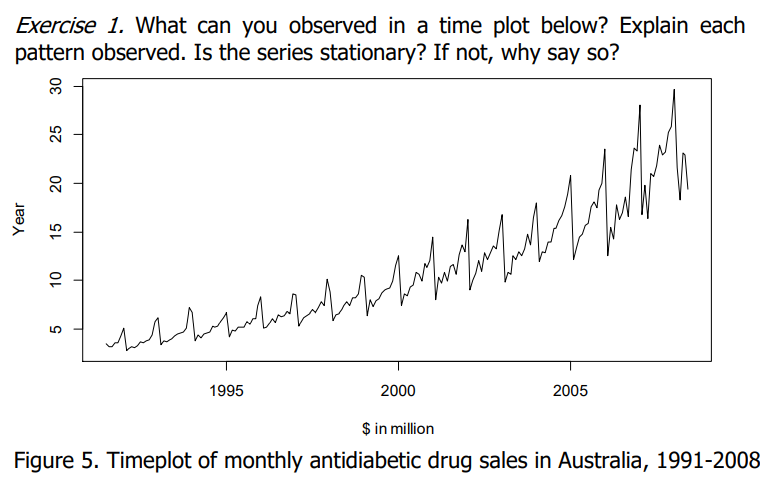
Exercise 1. What can you observed in a time plot below? Explain each pattern observed. Is the series stationary? If not, why say so? 30 20 10 اماماساسالالرا۔ 1995 2000 2005 $ in million Figure 5. Timeplot of monthly antidiabetic drug sales in Australia, 1991-2008 Year 15 25


Q: The data below show the number of gallons of gasoline (in 1,000s) sold by a gasoline distributor in…
A: Key Terms : Regression analysis includes a large group of methods that can be used to predict…
Q: The following table lists several corporate bonds issued during a particular quarter. Bank of…
A:
Q: The number of users of a certain website (in millions) from 2004 through 2011 follows. Year Period…
A: The question is about time series plot Given :
Q: Consider the following time series data: Year Value 1 234 2 287 255 3.
A: GIven, α = exponential smoothing coefficient Forecast, Ft = Ft-1 + α(At-1 - Ft-1) where, At =…
Q: a)Outline the diffences between simple, double and triple exponential smoothing? b) Consider the…
A: Exponential smoothing of time series data assigns exponentially decreasing weights for newest to…
Q: In a table of “Sales as a % of Moving Average” over a 5-year period the average of the four entries…
A: Given Solution:
Q: 10. A survey conducted over the last 25 years indicated that in 10 years the winter was mild, in 8…
A:
Q: canton Supplies, inc., is a service firm that employs approximately 100 individuals.Managers of…
A: a. From the given data set the time series plot can be plotted as follows: 1. Enter the data in…
Q: For each of the following common patterns found in time series, identify a reasonable example from…
A: Time - Series Patterns : A time series is a sequence of measurements taken every hour, day, week,…
Q: Example 6.19 From the data given in the following table, find out which of the two series is more…
A:
Q: The sales taken in for tickets to an ice-skating rink is recorded on a quarterly basis, for a period…
A: Given information: No. of periods=08 Quarter 1 2 3 4 5 6 7 8 Sales 7555 6695 5415 4150 7310…
Q: What characteristics would you expect from a time series that describes the number of vehicles…
A: Times series: A set of observations on the values that a variable takes at different times.
Q: The following information looks at computer ownership by year. 1985 8.2 (percentage of…
A: Enter the data in Excel.
Q: What pattern does the time series shown in the plot below demonstrate? 500 450 400 350 300 250 200…
A:
Q: Two forecasting methods have been used to evaluate the same economic time series. The results are…
A:
Q: Which components of time series data are evident in the graph shown below? 500- 400 - 300- 200 -…
A: The graph shown is between the time in year and the production of cars and shows a up and down…
Q: nterpret data visualization consisting of such tools as time series plots, box plots, and scatter…
A: We have given the data of X, monthly advertising dollars and Y, monthly revenue dollars. The scatter…
Q: ten weeks of data on the commodity Futures index are 7.35, 7.40, 7.55, 7.56, 7.60, 7.52,7.52, 7.70,…
A: Hello. Since your question has multiple sub-parts, we will solve first three sub-parts for you. If…
Q: Consider the following time series. Quarter Year 1 Year 2 Year 3 1 70 67 61 2 50 42 52 3 59 61 54 4…
A: a. The required time series plot canbe plotted using excel as follows: 1. Enter the given data into…
Q: What is the importance of a time series analysis ?
A: Time series: A time series is a set of observations measured at time or space intervals arranged in…
Q: A share has the following prices at the end of each of the years shown. What is the geometric…
A:
Q: Q1: The table below represents the annual average rainfall (mm) for each station A with the average…
A:
Q: 19.3% 16.9% 18.5% - 49.9% 43.1% 1.9% - 16.9% 46.3% 45.3% - 3.2% a. What is the arithmetic average…
A: Given See the excel output
Q: Consider the following time series data. Week 12 3 4 6 Value 16 12 14 11| 15 13 (a) Construct a time…
A: (a) The time series plot is obtained using EXCEL. The software procedure is given below: Enter the…
Q: 25 The following table gives the profits of a corfcern for 5 years ending 1983. Analysis of Time…
A:
Q: QUESTION ONE The following is a Time Series for sales collected over a four year t for a company in…
A: 1st quarter 2nd Quarter 3rd quarter 4th quarter 2018 92 91 95 94 2019 99 100 98 96 2020 108…
Q: Using simple exponential smoothing and the following time series data, respond to each of the items.…
A: Given information: The data presents the values of demand for the period 1 through 10.
Q: I need help with parts a, b, c, d,and e. Consider the following time series data. Week 1 2…
A: Hello. Since your question has multiple sub-parts, we will solve first three sub-parts for you. If…
Q: The pull-off force for a connector is measured in a laboratory test. Data for 40 test specimens…
A: Time series plot: Enter the data for the data in Excel sheet>Select the columns of data>Go to…
Q: The pull-off force for a connector is measured in a laboratory test. Data for 40 test specimens…
A: Time series plot: Enter the data for the data in Excel sheet>Select the columns of data>Go to…
Q: Quarterly revenue ($millions) for Twitter for the first quarter of 2012 through the first quarter of…
A: Hello. Since your question has multiple sub-parts, we will solve first three sub-parts for you. If…
Q: Exercise 2. What can you observed in a time plot below? Is there any pattern? Is the series…
A: A time series is a sequence of observations taken sequentially in time.
Q: The following table shows the quarterly sales of "Undercover Umbrellas" over a period of two years.…
A: We are given data and the first 4-point moving average
Q: 1) The following data are US exports to Mexico. Complete the missing values. a) Fill in the table.…
A: 1) a) The objective is to find the missing value in the table. The formula for ratio to moving…
Q: The geyser Old Faithful in Yellowstone National Park alternates periods of eruption, which typically…
A: Solution-: Given: Class width =5 and use 55 as the lower class limit for the first class We want to…
Q: Year 10 Yr Inflation 20 Yr Bond Yield 1956 0.025814878 0.0345 1957 0.019835599 0.0323 1958…
A: b) In the regression equation, the slope estimate has t distribution with n-2 degrees of freedom.…
Q: Consider the following time series data. Week 1 2 3456 Value 19 11 16 10 17 12 (a) Construct a time…
A: a) option (A) is correct The data appear to follow a horizontal pattern.
Q: Using simple exponential smoothing and the following time series data, respond to each of the items.…
A: “Since you have posted a question with multiple sub-parts, we will solve first three subparts for…
Q: The following table lists several corporate bonds issued during a particular quarter. Wells General…
A: Corporate bonds will provide simple interest. So to find the original investment we will use the…
Q: Series A 300 250 200 150 100 50 1 2 3 4 5 6 7 8 9 10 11 12 13 Which forecasting method would be most…
A: We know that there are various forecasting models in time series that can be used for forecasting…
Q: corporate triple-a bond interest rates for 12 consecutive months follow.9.5 9.3 9.4 9.6 9.8 9.7 9.8…
A: a.
Q: 1. Which of the following is an example of time series problem? a. Estimating number of covid 19…
A: According to the answering guidelines, we can answer only one question at a time and the rest can be…
Q: Corporate triple-A bond interest rates for 12 consecutive months follow. 9.5 9.3 9.4 9.6 9.8 9.7 9.8…
A: The interest rates for 12 consecutive months is given as: Time (t) Interest rates (A) 1 9.5 2…
Q: Use quantitative forecast methods for the data shown below. Period 1 2 3 4 5 7 |Observation 24 34 36…
A: a) i) Naïve method: a) ii) Three period moving average: 3 period moving average is average of 1st 3…
Q: In the theory of time series, earthquakes can be considered as a. Seasonal Variation b. Cyclical…
A: There are four components of time series a. Seasonal Variation b. Cyclical Variation c. Irregular…
Q: Corporate triple-A bond interest rates for 12 consecutive months follow. 9.5 9.3 9.4 9.6 9.8 9.7 9.8…
A: Given Information: A bond interest rates for 12 consecutive months are as follows: 9.5, 9.3, 9.4,…
Q: Six years of quarterly data of a seasonally adjusted series are used to estimate a linear trend…
A: See the handwritten solution
Topic: BASIC TOOLS IN FORECASTING (time series analysis)

Step by step
Solved in 4 steps with 2 images

- State the model used in time series analysis.(b) The following data represent the Coca-Cola's revenues (in $ hundred millions) during 2019-2022. Quarter 2019 2020 2021 2022 Oct-Dec Jan-Mar Apr-Jun Jul-Sep 44 56 55 49 45 53 54 49 41 54 53 48 45 57 58 52 (i) Plot the series in a line graph. Do you find any seasonal pattern? Calculate the seasonal index and interpret. (ii) Deseasonalized the data and fit a linear trend to the deseasonalized series. (iii)Obtain the deseasonalized forecasts and seasonal forecasts for 2023 revenues. In which quarter, the seasonal forecast has the most? The least? Is this logical? (iv) To estimate a regression model using seasonal binaries, set up a data set. If the estimated regression using seasonal binaries is given by Revenues = 48.31+ 0.12Time – 5.39 Qtr 1+ 5.74 Qtr 2+ 5.62 Qtr 3 Find the forecast the revenues for each quarter in 2023 and compare the forecasts in (iii).True or false: In a Time-series plot, the vertical axis represents time.
- Construct a time-series plot for the following number of customers shopping at a new mall during a given week. Day Number of Customers Monday Tuesday Wednesday Thursday Friday Saturday 525 540 469 500 586 64049- The increase or decrease in the movements of a time series is called ______________. a. Secular trend. b. Erratic Trend c. None d. Seasonal TrendStorrs Cycles has just started selling the new Cyclonemountain bike, with monthly sales as shown in the table. First,co-owner Bob Day wants to forecast by exponential smoothingby initially setting February’s forecast equal to January’s saleswith a = .1. Co-owner Sherry Snyder wants to use a three-periodmoving average. a) Is there a strong linear trend in sales over time?b) Fill in the table with what Bob and Sherry each forecast forMay and the earlier months, as relevant.c) Assume that May’s actual sales figure turns out to be 405.Complete the table’s columns and then calculate the meanabsolute deviation for both Bob’s and Sherry’s methods.d) Based on these calculations, which method seems moreaccurate?
- Consider the following annual progression of number of in-person customers of a store during January through the COVID years. Year Customers Growth rate 2019 576 2020 550 2021 100 2022 150 2023 600 2024 580 Find the “average” rate of growth of customers. What type of average would you use, so that if the growth were steady at that rate, you would end up with 580 customers in 2024? Also fill the blank spaces (except the top one) in the table with the appropriate growth rate (negative ok).For each of the following common patterns found in time series, identify a reasonableexample from the real-world that would likely exhibit this pattern.a. Horizontalb. Trendc. Seasonalityd. CyclicalParker is 50 and wants to retire in 15 years. His family has a history of living well into their 90s. Therefore, he estimates that he will live to age 95. He currently has a salary of $120,000 and expects that he will need about 65% of that amount annually at the beginning of each year if he were retired. He can earn 9 percent in his portfolio while he is working. However, he expects that he will only earn 7 percent in his portfolio during retirement. He expects inflation to continue at 3 percent. Parker currently has $350,000 invested for his retirement. His Social Security benefit in today’s dollars is $30,000 per year at normal age retirement of age 67. His Social Security benefit will be reduced by 6 2/3 percent for each year he begins collecting before full age retirement. How much does he need to save at the end of each year to meet his retirement goals (assume he does not wish to leave a financial legacy)?
- Calculate the approximate price relatives to two decimal places for the MTN and Vodacom stocks over the period in question. A. 0.71, 0.67 B. 0.57, 0.75 C. 0.75, 0.77 D. 0.70, 0.81What do you mean by Time Series Analysis?For each data series, (you can creat graph with year on x axis and data series on y axis to visually see if it appear stationary or not) carefully describe what appears to be happening over the period from 1982 to 2022, and why you think it is happening. Base your answer upon your knowledge of statistics and agriculture, along with common sense. If you are not entirely sure what is happening. In some cases what is happening in one graph may affect what you see in another. Dataset: Year Spring wheat seeded acreage Wheat cost of production ($/acre) Spring wheat yield (bushels/acre) Spring wheat production (bu per acre) Wheat price ($/ tonne) Canola production (tonnes) Canola price ($/ tonne) Canola Seeded acreage 1982 4,000,000 167.9 34 136,000 165 399,200 260 850,000 1983 4,600,000 153.3 27.2 125,300 174 397,000 383 950,000 1984 4,450,000 171.4 30.9 137,500 172 544,000 351 1,200,000 1985 4,850,000 166.6 39.6 192,000 156 635,000 263 1,000,000 1986 4,940,000 164.3 33.2…