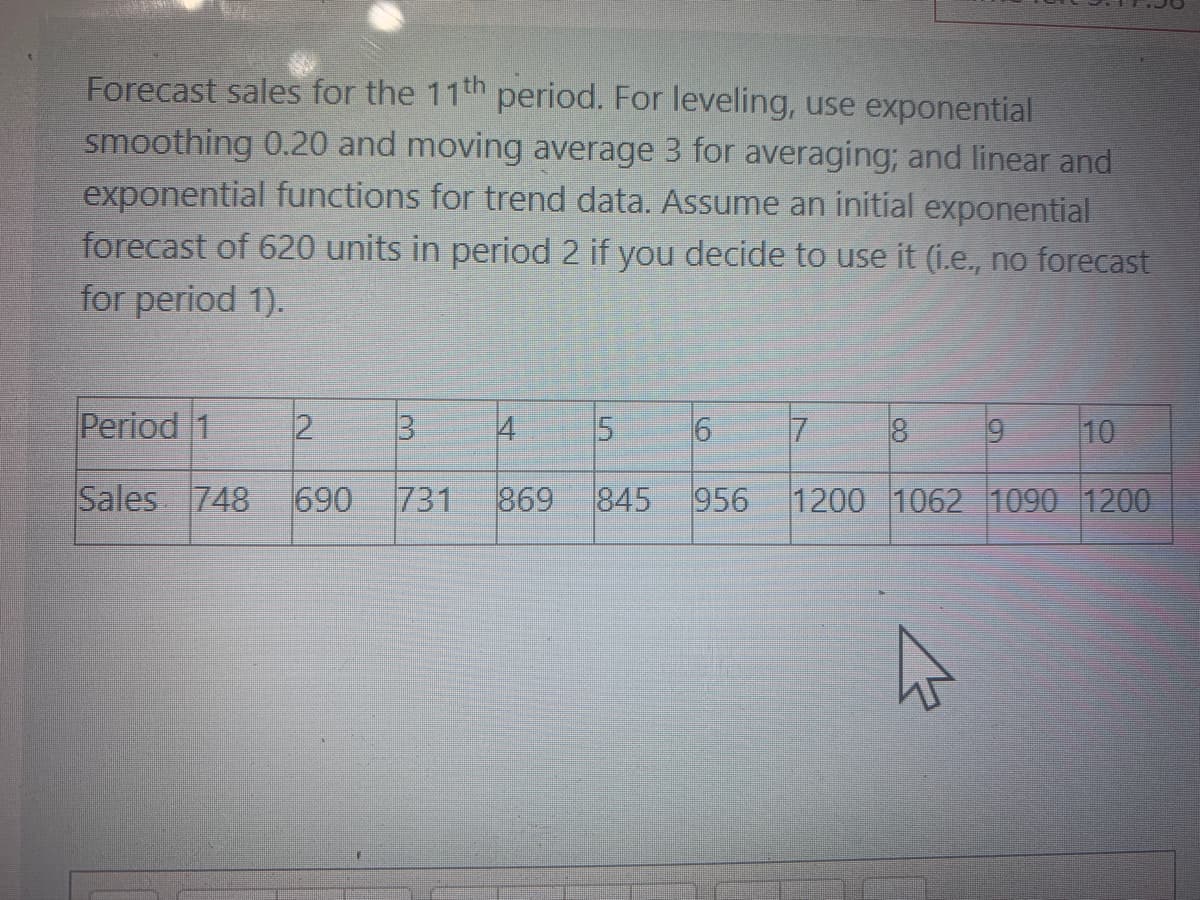
exponential functions for trend data. Assume an initial exponential Forecast of 620 units in period 2 if you decide to use it (i.e., no forecast For period 1).


Q: Use a three-period weighted-moving average forecast to determine a forecast for the 8th week using…
A: THE ANSWER IS AS BELOW:
Q: snip
A: Answer: It is important to measure the accuracy of forecasts, for any forecasting technique and…
Q: Consider the following set of time series sales data for a growing company over the past 8 months:…
A: The time series plot shows a horizontal pattern.
Q: a. Using a simple three-month moving average, make a forecast for this month. (Round your answer to…
A: Forecasting is the process of predicting the future demand according to past data and demand.
Q: The actual number of patients at Omaha Emergency Medical Clinic for the first sIX weeks of this year…
A: This problem can be solved using the weighted moving average method of forecasting.
Q: Discuss the basic assumptions made when using time series forecasting techniques as opposed to…
A: Several assumptions are made during the Time Series Initial Phase.
Q: A. Forecast sales in August using the 3-month moving average method. B. Forecast sales for the month…
A: Forecasting is the process of estimating the funture demand using the previous or historic data and…
Q: The Grand Bakery produces 60 special sourdough rolls every day. Any rolls that are not sold each day…
A: Forecasting is the process of prediction in which sales demand is estimated using historic…
Q: All forecasting methods using exponential smoothing, adaptive smoothing, and exponential smoothing…
A: Forecasting is the process of predicting future demand values based on historical data. The…
Q: a. Predict the sales for Jasmine Slush using the following forecasting methods: - naïve (use simple…
A: Forecasting is to predict the uncertain future of demand and sales. There are various methods to do…
Q: Using the data set below, what would be the forecast for period 5 using the exponential smoothing…
A: Forecasting is the process of estimating future sales or demand using previous data and information.…
Q: The manager of a travel agency has been using a seasonally adjusted forecast to predict demand for…
A: ANSWER IS AS BELOW:
Q: What are the basic assumptions made when using time series forecasting techniques as opposed to…
A: Stationarity: The first assumption is that the series of data points are stationary. The series is…
Q: Simple exponential smoothing with a 5 0.3 is being used to forecast sales of digital cameras at…
A: Given Smoothing constant a=0.3 Forecast for September = 100 cameras Sales in September = 120 cameras
Q: Explain the basic assumptions made when using time series forecasting techniques as opposed to…
A: The Time Series Initial Phase makes a variety of assumptions.
Q: The number of fishing rods selling each day is given below. Perform analyses of the time series to…
A: Note: - Since we can answer up to three subparts, we will answer the first three subparts here. If…
Q: Explain why forecasts are generally wrong.
A: Forecasting is used to predict future changes or demand patterns.
Q: Obtain the linear trend equation for the following data on new checking accounts at Fair Savings…
A: Linear trend equation is given by: y = a+bx here, a = intercept and b = slope Formulas used: a = ∑y…
Q: Compute a 3-month weighted average forecast for months 4 through 9. Assign weights of 0.55, 0.33 and…
A: Forecasting is a technique used to predict future outcomes on the basis of past data. There are…
Q: a. Solve for the forecast equation. b. Forecast the four quarters of year 5.
A: Operations management is a branch of management in which the production process and service of the…
Q: DEMAND FORECAST WITH LINEAR REGRESSION Historical demand for a product is: Period MONTH DEMAND x2 XY…
A: Period (x) Month Demand (y) 1 January 12 2 February 11 3 March 15 4 April 12 5 May 16 6…
Q: Using trend-adjusted exponential smoothing, Forecasts (F₂), Trend (T₂), and Forecasts Including…
A: Forecasting is a technique used to predict future outcomes on the basis of past data. In businesses…
Q: Forecast accuracy decreases with the long range forecast. True or False? Explain
A: Forecasting is a technique of predicting future events based on historical data and projecting them…
Q: Tom’s Towing LLC operates a fleet of tow trucks that it sends to help drivers in need onthe nearby…
A:
Q: Calculate the forecast for Week 16 using - a 2-period moving average - a 3-period moving average…
A: Given data is
Q: Moving Average method is always superior to Weighted moving average method for time series forecast
A: The moving method average is
Q: The accompanying dataset provides data on the monthly usage of natural gas (in millions of cubic…
A: Given data is Alpha = 0.6 Gamma = 0.8
Q: The demand for Krispee Crunchies, a favorite breakfast cereal of people born in the 1940s, is…
A: Trend forecast is a quantitative data forecasting method where we use past data for finding out…
Q: With a = 0.1 and the initial forecast for October of $1.83, using exponential smoothing, the…
A: Forecasting is a technique used to predict future outcomes on the basis of past data. In businesses…
Q: All forecasting methods using exponential smoothing, adaptive smoothing, and exponential smoothing…
A: Forecasting is the process of making assumptions of the future on the basis of past and present…
Q: What benefits does exponential smoothing have over moving averages as a forecasting tool?
A: As a forecasting function, exponential smoothing has the following benefits over running averages:…
Q: c. Using simple exponential smoothing, what would your forecast be for this month if the…
A:
Q: A manufacturer of printed circuit boards uses exponential smoothing with trend to forecast monthly…
A: Following formulas are used for calculation: St-1= Average Sales for the month Tt-1=Additional trend…
Q: Based on the time series data presented above, do the forecasts using 2-month moving average (2-MA)…
A: THE ANSWER IS AS BELOW:
Q: Forecast is calculating estimates of future cycle/s based on data of past cycles, there is no…
A: Forecasting is the way toward making expectations dependent on over a significant time span…
Q: Which time-series forecasting method works best if the company assumes that product demand will…
A: Forecasts are a basic input in the decision processes of operations management because they provide…
Q: Consider the following forecasting model: x^t,t+1=axt+(1-a)x^t-1,t If a decreases from 0.5 to 0.2,…
A: The given question is about exponential smoothing.
Q: What effect does the number of cycles in a moving average have on the forecast's responsiveness?
A: In order to estimate potential demand, the Moving Average (MA) projection method uses the MA formula…
Q: Management of Davis’s Department Store has used time-series extrapolation to forecast retail sales…
A: Note: - Since the exact question that has to be answered is not specified, we will answer only the…
Q: snip
A: A moving average forecast becomes less responsive to change in a data series when more data points…
Q: The manager of a popular tourist resort wants to use the manual trend projection forecasting…
A: The equation for exponential smoothing is- Ft = F t-1 + α(A t-1 – Ft-1) Ft = the exponentially…
Q: The Excel file (Forecasting Assignment Data) contains quarterly motorcycle shipments for…
A: Find the Given details below: Given details: Year Quarter Period DemandAt 2000 1 1 49057…
Q: What is seasonality?How do we forecast using data that has seasonality?
A: Seasonality in time series data is the occurrence of repetitive up and down cycles in series values…
Q: Given the Exponential Smoothing Method, Actual Demand alpha = .25 and Forecast Demand alpha = 0.75,…
A:
Q: Generate forecasts for data with diff erent patterns, such as level, trend, and seasonality and…
A: Solution Introduction with Generate Forecasting for data Forecasting is a logical extension of the…
Q: Forecast sales for the 11th period. For leveling, use exponential smoothing 0.20 and moving average…
A: Use exponential formula = α×Actual demand+(1-α)×previous demand
Q: State and explain the weakness of standard forecasting technique in forecasting approaches
A: To be determined: the weakness of standard forecasting technique
Q: Forecasting The manager of a popular tourist resort wants to use the manual trend projection…
A: The benefit of the forecasting technique is 1) Cost reduction2) Inventory reduction and management…
Q: orecast sales for the 11th period. For leveling, use exponential smoothing 0.20 and moving average 3…
A: THE ANSWER IS AS BELOW:
Q: Explain why such forecasting devices as moving averages, weighted moving averages, and exponential…
A: Forecasting is the anticipating the future demand considering the historical data. Following are the…


Trending now
This is a popular solution!

Step by step
Solved in 2 steps with 2 images

- Under what conditions might a firm use multiple forecasting methods?The Baker Company wants to develop a budget to predict how overhead costs vary with activity levels. Management is trying to decide whether direct labor hours (DLH) or units produced is the better measure of activity for the firm. Monthly data for the preceding 24 months appear in the file P13_40.xlsx. Use regression analysis to determine which measure, DLH or Units (or both), should be used for the budget. How would the regression equation be used to obtain the budget for the firms overhead costs?The file P13_42.xlsx contains monthly data on consumer revolving credit (in millions of dollars) through credit unions. a. Use these data to forecast consumer revolving credit through credit unions for the next 12 months. Do it in two ways. First, fit an exponential trend to the series. Second, use Holts method with optimized smoothing constants. b. Which of these two methods appears to provide the best forecasts? Answer by comparing their MAPE values.
- The file P13_22.xlsx contains total monthly U.S. retail sales data. While holding out the final six months of observations for validation purposes, use the method of moving averages with a carefully chosen span to forecast U.S. retail sales in the next year. Comment on the performance of your model. What makes this time series more challenging to forecast?The file P13_02.xlsx contains five years of monthly data on sales (number of units sold) for a particular company. The company suspects that except for random noise, its sales are growing by a constant percentage each month and will continue to do so for at least the near future. a. Explain briefly whether the plot of the series visually supports the companys suspicion. b. By what percentage are sales increasing each month? c. What is the MAPE for the forecast model in part b? In words, what does it measure? Considering its magnitude, does the model seem to be doing a good job? d. In words, how does the model make forecasts for future months? Specifically, given the forecast value for the last month in the data set, what simple arithmetic could you use to obtain forecasts for the next few months?The file P13_26.xlsx contains the monthly number of airline tickets sold by the CareFree Travel Agency. a. Create a time series chart of the data. Based on what you see, which of the exponential smoothing models do you think will provide the best forecasting model? Why? b. Use simple exponential smoothing to forecast these data, using a smoothing constant of 0.1. c. Repeat part b, but search for the smoothing constant that makes RMSE as small as possible. Does it make much of an improvement over the model in part b?
- The file P13_29.xlsx contains monthly time series data for total U.S. retail sales of building materials (which includes retail sales of building materials, hardware and garden supply stores, and mobile home dealers). a. Is seasonality present in these data? If so, characterize the seasonality pattern. b. Use Winters method to forecast this series with smoothing constants = = 0.1 and = 0.3. Does the forecast series seem to track the seasonal pattern well? What are your forecasts for the next 12 months?The file P13_28.xlsx contains monthly retail sales of U.S. liquor stores. a. Is seasonality present in these data? If so, characterize the seasonality pattern. b. Use Winters method to forecast this series with smoothing constants = = 0.1 and = 0.3. Does the forecast series seem to track the seasonal pattern well? What are your forecasts for the next 12 months?The owner of a restaurant in Bloomington, Indiana, has recorded sales data for the past 19 years. He has also recorded data on potentially relevant variables. The data are listed in the file P13_17.xlsx. a. Estimate a simple regression equation involving annual sales (the dependent variable) and the size of the population residing within 10 miles of the restaurant (the explanatory variable). Interpret R-square for this regression. b. Add another explanatory variableannual advertising expendituresto the regression equation in part a. Estimate and interpret this expanded equation. How does the R-square value for this multiple regression equation compare to that of the simple regression equation estimated in part a? Explain any difference between the two R-square values. How can you use the adjusted R-squares for a comparison of the two equations? c. Add one more explanatory variable to the multiple regression equation estimated in part b. In particular, estimate and interpret the coefficients of a multiple regression equation that includes the previous years advertising expenditure. How does the inclusion of this third explanatory variable affect the R-square, compared to the corresponding values for the equation of part b? Explain any changes in this value. What does the adjusted R-square for the new equation tell you?
- Forecast sales for the 11th period. For leveling, use exponential smoothing 0.20 and moving average 3 for averaging; and linear and exponential functions for trend data. Assume an initial exponential forecast of 60 units in period 2 if you decide to use it (i.e., no forecast for period 1). Period 1 2 3 4 5 6 7 8 9 10 Sales 748 690 731 869 845 956 1200 1062 1090 1200Forecast is calculating estimates of future cycle/s based on data of past cycles -- there is no What? time interval in forecastingForecast sales for the 7th period. For leveling, use exponential smoothing 0.20 and moving average 3 for averaging; and linear and exponential functions for trend data. Assume an initial exponential forecast of 60 units in period 2 if you decide to use it (i.e., no forecast for period 1). Period Demand 1 67 2 72 3 68 4 20 5 70 6 66 7 68

