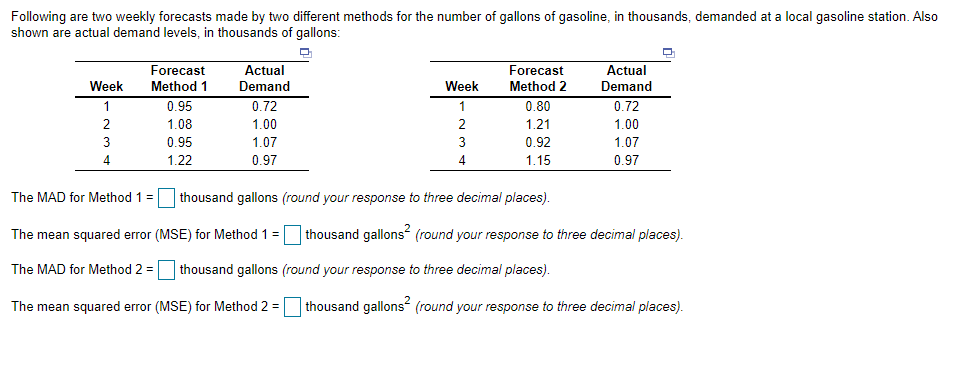
Following are two weekly forecasts made by two different methods for the number of gallons of gasoline, in thousands, demanded at a local gasoline station. Also shown are actual demand levels, in thousands of gallons: Forecast Forecast Method 1 Actual Demand Actual Demand Week Week Method 2 1 0.95 0.72 0.80 0.72 1.08 1.00 1.21 1.00 3 0.95 1.07 0.92 1.07 4 1.22 0.97 4 1.15 0.97 The MAD for Method 1 = thousand gallons (round your response to three decimal places). The mean squared error (MSE) for Method 1 = thousand gallons (round your response to three decimal places). The MAD for Method 2 = thousand gallons (round your response to three decimal places). The mean squared error (MSE) for Method 2 = thousand gallons (round your response to three decimal places).
Following are two weekly forecasts made by two different methods for the number of gallons of gasoline, in thousands, demanded at a local gasoline station. Also shown are actual demand levels, in thousands of gallons: Forecast Forecast Method 1 Actual Demand Actual Demand Week Week Method 2 1 0.95 0.72 0.80 0.72 1.08 1.00 1.21 1.00 3 0.95 1.07 0.92 1.07 4 1.22 0.97 4 1.15 0.97 The MAD for Method 1 = thousand gallons (round your response to three decimal places). The mean squared error (MSE) for Method 1 = thousand gallons (round your response to three decimal places). The MAD for Method 2 = thousand gallons (round your response to three decimal places). The mean squared error (MSE) for Method 2 = thousand gallons (round your response to three decimal places).

Practical Management Science
6th Edition
ISBN:9781337406659
Author:WINSTON, Wayne L.
Publisher:WINSTON, Wayne L.
Chapter13: Regression And Forecasting Models
Section13.3: Simple Regression Models
Problem 1P: The file P13_01.xlsx contains the monthly number of airline tickets sold by a travel agency. a. Does...

Related questions
Question
Can you assit me with this problem 2 by showing me the process step by step. I prefer it not be in the form of an excel sheet because it is hard to follow along. Thank you kindly
Transcribed Image Text:Following are two weekly forecasts made by two different methods for the number of gallons of gasoline, in thousands, demanded at a local gasoline station. Also
shown are actual demand levels, in thousands of gallons:
Actual
Demand
Forecast
Actual
Forecast
Week
Method 1
Demand
Week
Method 2
1
0.95
0.72
1
0.80
0.72
2
1.08
1.00
2.
1.21
1.00
3
0.95
1.07
0.92
1.07
4
1.22
0.97
1.15
0.97
The MAD for Method 1 =
thousand gallons (round your response to three decimal places).
The mean squared error (MSE) for Method 1 = thousand gallons (round your response to three decimal places).
The MAD for Method 2 = thousand gallons (round your response to three decimal places).
The mean squared error (MSE) for Method 2 =
thousand gallons (round your response to three decimal places).
Expert Solution
This question has been solved!
Explore an expertly crafted, step-by-step solution for a thorough understanding of key concepts.

This is a popular solution!

Trending now
This is a popular solution!

Step by step
Solved in 2 steps

Recommended textbooks for you
Practical Management Science
Operations Management
ISBN:
9781337406659
Author:
WINSTON, Wayne L.
Publisher:
Cengage,
Practical Management Science
Operations Management
ISBN:
9781337406659
Author:
WINSTON, Wayne L.
Publisher:
Cengage,