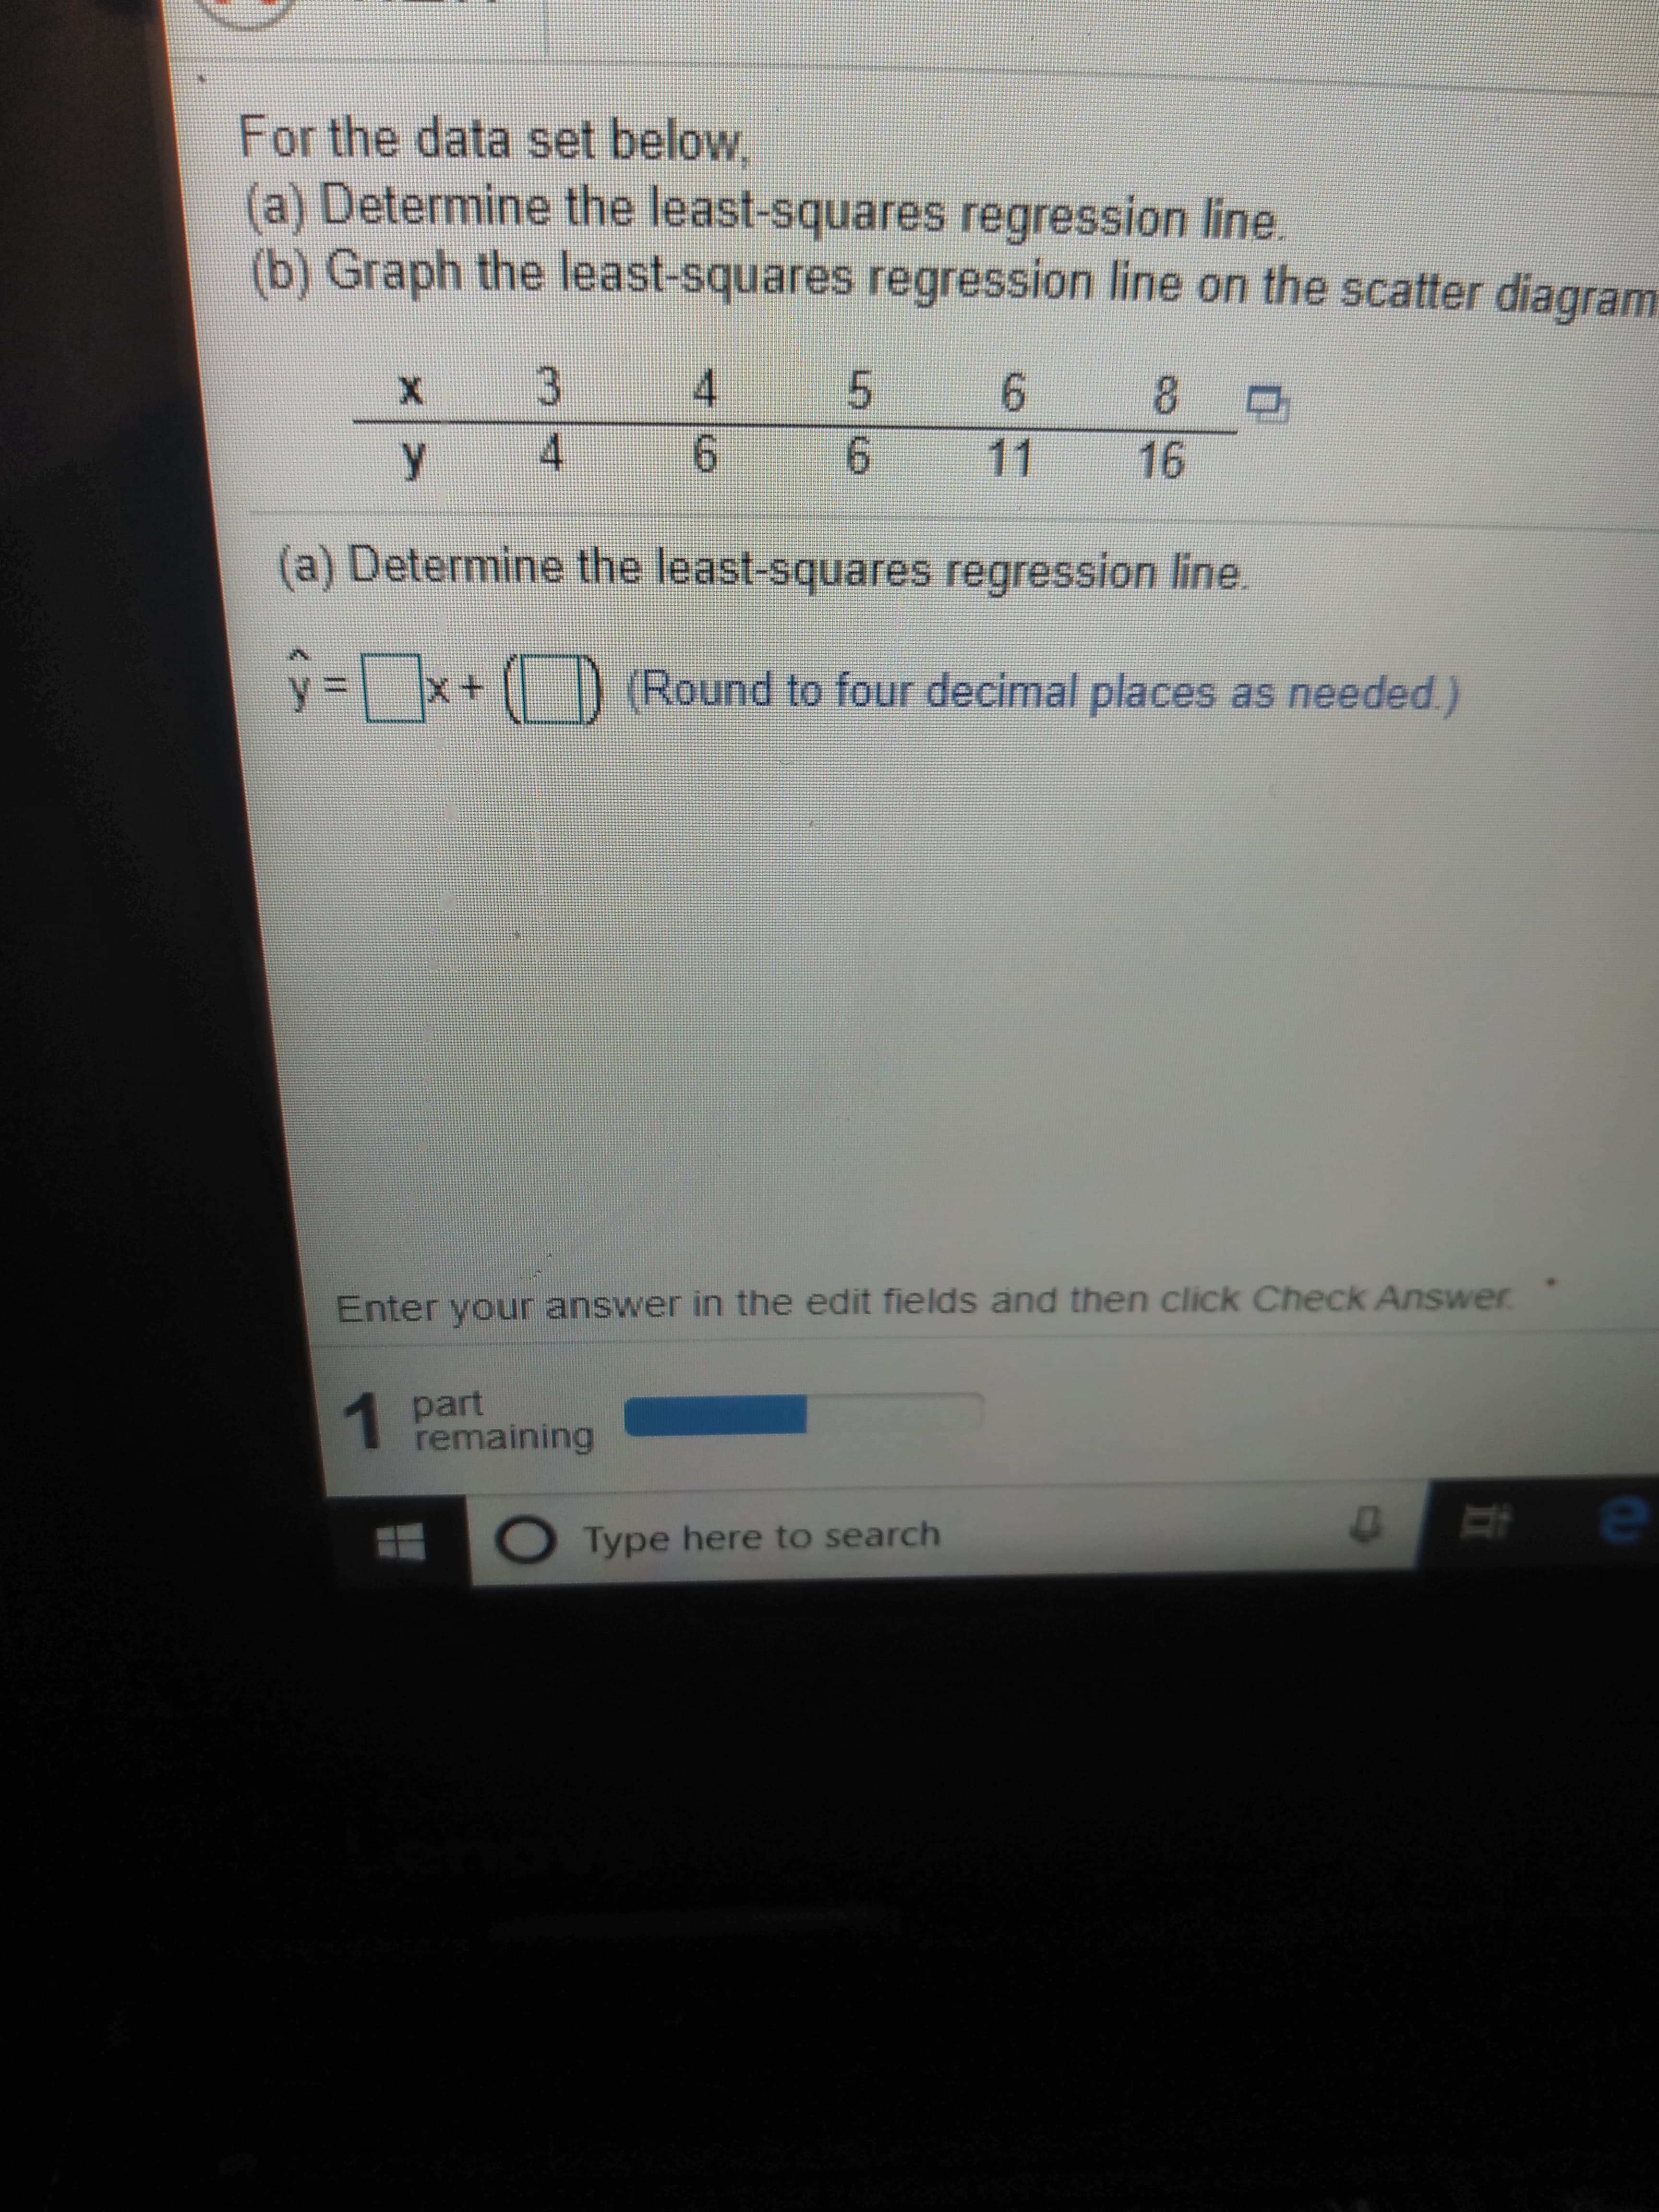
For the data set below (a) Determine the least-squares regression line (b) Graph the least-squares regression line on the scatter diagram 3 4 6 8 4 6 11 16 (a) Determine the least-squares regression line ) (Round to four decimal places as needed) y =x Enter your answer in the ed it fields and then click Check Answer part 1 remaining e Type here to search X


Q: The data below represent commute times in minutes) and scores on a well-being survey. Complete parts…
A: The sums are, x y x2 y2 xy 5 69.1 25 4774.81 345.5 20 67.7 400 4583.29 1354 25 67.1 625…
Q: Interpreting technology: The following display from the TI-84 Plus calculator presents the…
A: From the provided information, The intercept a = 2.22055585 Slope b = 0.338208
Q: The data in the table represent the number of licensed drivers in various age groups and the number…
A:
Q: The data below represent commute times (in minutes) and scores on a well-being survey. Complete…
A: Given,
Q: Scraps of iron were selected on the basis of their densities, x, and their iron contents, y, were…
A: A scatter plot is used to visualise the relation between two variables. Each data point is plated on…
Q: Given below are five observations collected in a regression study on two variables, x (independent…
A: It is given that the five observation on two variables x and y.
Q: For the data set below, (a) Determine the least-squares regression line. (b) Compute the sum of the…
A: Given data, x y 30 114 40 103 50 103 60 89 70 79
Q: 3. Bealer invoice and list price for cars (thousands of dollars) List price X 32.1 33.4 47.8 36.1…
A: Hii ! Thanks for posting the question . Since your question has more than three subparts , we have…
Q: Given the bivariate data : x y 0 -0.1 1 -3.3 2 -6.1 3 -9.6 4 -12.2 Find the least squares regression…
A: From given data, X Y X*Y X*X 0 -0.1 -0 0 1 -3.3 -3.3 1 2 -6.1 -12.2 4 3 -9.6 -28.8 9 4…
Q: The least-squares regression line for a set of (Age, Skill_Score) data is yn = 5.0x + 0.7. The data…
A: Here, it is given that the least-squares regression line for a set of (Age, Skill_Score) data is yn…
Q: The data below represent commute times (in minutes) and scores on a well-being survey. Complete…
A:
Q: An engineer wants to determine how the weight of a gas-powered car, x, affects gas mileage, y. The…
A: Regression equation is given by,
Q: 2. The data in the table represent the weights of various domestic %3D year. For these data, the…
A: Coefficient of Determination: It is a statistical measure commonly used in the testing of hypotheses…
Q: The average number of people in a family that received welfare for various years is given below.…
A: Year(x) Welfare(y) xy x2 y2 1969 4 7876 3876961 16 1973 3.6 7102.8 3892729 12.96 1975…
Q: An engineer wants to determine how the weight of a gas-powered car, x, affects gas mileage, y. The…
A: From given data, X Y X*Y X*X 3780 18 68040 14288400 3865 16 61840 14938225 2768 24 66432…
Q: The data below represent commute times (in minutes) and scores on a well-being survey. Complete…
A: From given data, 5 69.3 346.5 25 15 68.3 1024.5 225 30 67.3 2019 900 40 66.9 2676 1600 60…
Q: The data below represent commute times (in minutes) and scores on a well-being survey. Complete…
A:
Q: Consider the data set given in the accompanying table. Complete parts (a) through (d). E Click the…
A: Given, x y -2 -4 -1 0 0 1 1 3 2 5 The table below shows the required calculation-…
Q: To determine the effect of temperature on the yield of a certain chemical process, the process is…
A:
Q: 1. David was comparing the number of vocabulary words children know about transportation at various…
A: Given information Predictor Coef SE Coef T P Constant 3.371 1.337 2.52 0.065…
Q: (a) Find the least-squares regression line for males treating the number of licensed drivers as the…
A: (a) Use EXCEL to determine the regression equation for males. EXCEL procedure: Go to EXCEL Go…
Q: Interpreting technology: The following display from the TI-84 Plus calculator presents the…
A: Given : x is the prime interest rate in percent y is the price of certain stock a = 2.295225776 b =…
Q: Second Paired Data Set 5 8 6. 10 11 13 17 19 37. Use the Second Paired Data Set. Find the equation…
A: Solution-: We find the least square regression line
Q: The data in the table represent the number of licensed drivers in various age groups and the number…
A: Given information: Age Number of Male Licensed Drivers Number of fatal crashes (Males) Number of…
Q: Correct reading y(bar) 0.96 1.33 1.75 2.14 2.58 2.97 3.38 3.75 (a) Find the least squares line for…
A:
Q: n article gave a scatter plot along with the least squares line of x = rainfall volume (m²) and y =…
A: Given, Independent variable (x) = rainfall volume Dependent variable (y) = runoff volume By using…
Q: With the vibrating wear of mild steel and oil viscosity in an article in Wear(1992) relevant data is…
A: Here, For the given data, x=oil Viscosity y=wear volume Least-squares methods is used to construct a…
Q: The data in the table represent the number of licensed drivers in various age groups and the number…
A: The least-square regression line for males, x y x2 y2 x⋅y 12 227 144 51529 2724 6424 5180…
Q: The data in the table represent the number of licensed drivers in various age groups and the number…
A: Given: Age No. of male Licensed drivers No. of fatal crashes No. of female licensed drivers…
Q: An engineer wants to determine how the weight of a gas-powered car, x, affects gas mileage, y. The…
A:
Q: The data in the table represent the number of licensed drivers in various age groups and the number…
A: a) Step-by-step procedure to find the regression equation using Excel: In Excel sheet, enter Number…
Q: An engineer wants to determine how the weight of a gas-powered car, x, affects gas mileage, y. The…
A:
Q: An economist want to determine the relation between one’s FICO score, x, and the interest rate of a…
A: Least square regression: Suppose (x1, y1), (x2, y2)---(xn, yn) are n pairs of observations on…
Q: Y 5 4 5 10 12 15 Assume that x is the explanatory variable and y is the response variable. What is…
A: The strength of the relationship between 2 variables can be calculated using the correlation…
Q: An electric utility wishes to examine the relationship between temperature and electricity use in…
A: Regression Equation: When we want to predict the value of one variable, say Y, from the given value…
Q: 2. Given the following data: X number of inventors in company Y number of patents 12.0 15.0 17.0…
A: Hi, we are supposed to answer three subparts at a time. Since you have not mentioned which subpart…
Q: The data in the table represent the number of licensed drivers in various age groups and the number…
A: The simple linear regression is used to estimate or predict the response variables. It consist of…
Q: An article gave a scatter plot along with the least squares line of x = rainfall volume (m) and y =…
A:
Q: A data set is given below. (a) Draw a scatter diagram. Comment on the type of relation that appears…
A: a) Use the excel to draw the scatter plot of the given data points: The correct option for the…
Q: Q3: Table below shows the age in years and the retail value in thousands of pounds of a random…
A: As per our guidelines, we are allowed to answer first three sub-parts only. Thanks Given Data : X =…
Q: The data below represent commute times (in minutes) and scores on a well-being survey x (Commute…
A: a. In this case, the explanatory variable is the commute time (x) and the response variable is the…
Q: An engineer wants to determine how the weight of a gas-powered car, x, affects gas mileage, y. The…
A: Given information- We have given the weights of various domestic cars and their miles per gallon in…
Q: The cost of a leading liquid laundry detergent in different sizes is given below. Size (ounces)…
A: Given observation and calculation Size(x) Cost(y) X2 Y2 XY 16 3.29 256 10.8241…
Q: An engineer wants to determine how the weight of a gas-powered car, x, affects gas mileage, y. The…
A: (a) Use EXCEL to obtain the regression equation. EXCEL procedure: Go to EXCEL Go to…
Q: An engineer wants to determine how the weight of a gas-powered car, x, affects gas mileage, y. The…
A: Since you have posted a question with multiple sub-parts, we will solve first three sub- parts for…
Q: A data set is given below. (a) Draw a scatter diagram. Comment on the type of relation that appears…
A: Scatter Plot: Scatter plot is the graphical representation of the relationship between two variables…
Q: Interpreting technology: The following display from the TI-84 Plus calculator presents the…
A: Given, Y is the price of a certain stock X is the prime interest rate in percent y=a+bx a…
Q: 1. What is the least-squares regression line? (A) A line that makes the sum of the squares of the…
A: Least-Square Regression Line: The plot shows the linear relationship between the regressor Y and…
Q: Applied Voltage (v) 5 10 15 20 25 30 35 40 45 50 Current (mA) 7 10 14 16 19 24 26 29 33 36 a) Draw a…
A: Given the data on applied voltage and current. Using the data we have to draw the scatter diagram…


Trending now
This is a popular solution!

Step by step
Solved in 5 steps with 3 images

- The number of inches that a recently built structure sits on the ground is given by (image) where x is its age in months. a) Create a scatter plot to verify that it is reasonable to assume that the regression of Y on x is linear.b) Fit a straight line using the method of least squares. c) Use the least squares method to estimate alpha.Assume that the table below displays the number of freight tonnes carried (in millions) in Australia between 1990 and 2015.Year199019952000200520102015Number of freight tonnes (millions)6684104126160186a) Draw a scatter diagram of the data.b) Find the least squares regression line of number of freight tonnes (in millions) carried on a year. (Note: Use only the last two digits of the year).c) Draw the line in (b) on the scatter diagram in (a). Comment on whether you feel the line is a good fit of the data.d) Use the line in (b) to predict the number of freight tonnes that might be carried in Australia in both 2020 and 2025.e) Do you think your predictions in (d) will be relatively accurate? Why or why not?Table gives life expectancies for people born in the United States in the given years. (a) Determine the least squares approximating line for these data and use it to predict the life expectancy of someone born in 2000. (b) How good is this model? Explain.
- An owner of a home in the Midwest installed solar panels to reduce heating costs. After installing the solar panels, he measured the amount of natural gas used y (in cubic feet) to heat the home and outside temperature x (in degree-days, where a day's degree-days are the number of degrees its average temperature falls below 65° F) over a 23-month period. He then computed the least-squares regression line for predicting y from x and found it to be ŷ = 85 + 16x. The software used to compute the least-squares regression line for the equation above says that r2 = 0.98. This suggests which of the following? 1. Gas used increases by square root of 0.98 = 0.99 cubic feet for each additional degree-day? 2. Although degree-days and gas used are correlated, degree-days do not predict gas used very accurately. 3. Prediction of gas used from degree-days will be quite accurate.Fit a curve of the form g(x) = A10Bx to the dataset using the Least Squares Method. Calculate the corrected values and the total squared error.(a) sketch the line that appears to be the best fit for the given points, (b) find the least squares regression line, and (c) determine the sum of squared error.
- A manager at the Camden Walmart is interested in learning more about the relationship between the number of customers in a checkout line and the total time it takes to check out. She selects a random sample of 11 customers and measured the number of customers who were in front of the selected customer in line and the time until that customer had finished checking out. An analysis of the data is provided below. Identify and interpret the y-intercept of the least squares regression line in context. Identify the coefficient of determination, r2. Interpret it in context. One of the data points appears to be an outlier. Describe this point and explain why it is considered an outlier.An engineer wants to determine how the weight of a gas-powered car, x, affects gas mileage, y. The accompanying data represent the weights of various domestic cars and their miles per gallon in the city for the most recent model year. Complete parts (a) Find the least-squares regression line treating weight as the explanatory variable and miles per gallon as the response variable.A random sample of 65 high school seniors was selected from all high school seniors at a certain high school. The following scatterplot shows the height, in centimeters (cm), and the foot length, in cm, for each high school senior from the sample. The least-squares regression line is shown. The computer output from the least-squares regression analysis is also shown. Term Coef(SE) CoefT-ValueP-Value Constant 105.086.0017.510.000 Foot length 2.5990.23810.920.000 S=5.90181R–sq=65.42% (a) Calculate and interpret the residual for the high school senior with a foot length of 20cm and a height of 160cm. BoldItalicUnderlineSuperscriptSubscriptUndoRedoΩBullet listNumbered listImage (12 image limit) Edit imageView imageDelete image Question 2 (b) The standard deviation of the residuals is s=5.9. Interpret the value in context. BoldItalicUnderlineSuperscriptSubscriptUndoRedoΩBullet listNumbered listImage (12 image limit) Edit imageView imageDelete…
- A magazine publishes restaurant ratings for various locations around the world. The magazine rates the restaurants for food, decor, service, and the cost per person. Develop a regression model to predict the cost per person, based on a variable that represents the sum of the three ratings. The magazine has compiled the accompanying table of this summated ratings variable and the cost per person for 25 restaurants in a major city. Assuming a linear relationship, use the least-squares method to compute the regression coefficients b0 and b1.A researcher at a large company has collected data on the beginning salary and current salary of 50 randomly selected employees. The correlation between the data sets is r = 0.912. The summary statistics from the data collected are shown bellow: Beginning Salary Ending Salary Mean x¯=56,340 y¯=82,070 Standard deviation Sx = 5,470 Sy = 7,800 Use a complete sentence to describe the strength and direction of the linear relationship between beginning salary and current salary. Find the equation of the least-squares regression line. (Round to two decimal places)A study of IT companies has found the following data on the age of each company and its annual volume of sales: Age (years) Sales (000) 2 22 2.5 34 3 33 4 37 4.5 40 4.5 45 5 49 3 30 6 58 6.5 58 (a) Determine the least squares regression that relates the age of company variable to the sales variable in the form y = a + bx. (b) Provide a practical interpretation of the coefficients a and b. (c) Determine the ‘goodness of fit’ (R2) of the estimated regression line. d) Using the estimated regression line determined in (a), calculate what volume of sales would be predicted for a company that is 3.5 years of age. (e) If it was found that…


