For the SPSS output below, imagine that this is an experiment looking at differences between men (group 1) and women (group 2) in terms of their level of math enjoyment: a. Explain what the results mean…are you rejecting the null, or failing to reject the null? are the results statistically significant or not? b. Write dow
For the SPSS output below, imagine that this is an experiment looking at differences between men (group 1) and women (group 2) in terms of their level of math enjoyment: a. Explain what the results mean…are you rejecting the null, or failing to reject the null? are the results statistically significant or not? b. Write dow

Glencoe Algebra 1, Student Edition, 9780079039897, 0079039898, 2018
18th Edition
ISBN:9780079039897
Author:Carter
Publisher:Carter
Chapter10: Statistics
Section10.4: Distributions Of Data
Problem 7PPS

Related questions

Question
For the SPSS output below, imagine that this is an experiment looking at differences between men (group 1) and women (group 2) in terms of their level of math enjoyment:
a. Explain what the results mean…are you rejecting the null, or failing to reject the null? are the results statistically significant or not?
b. Write down a simple conclusion sentence that a friend who has never taken statistics will be able to read and understand in terms of what the results found.
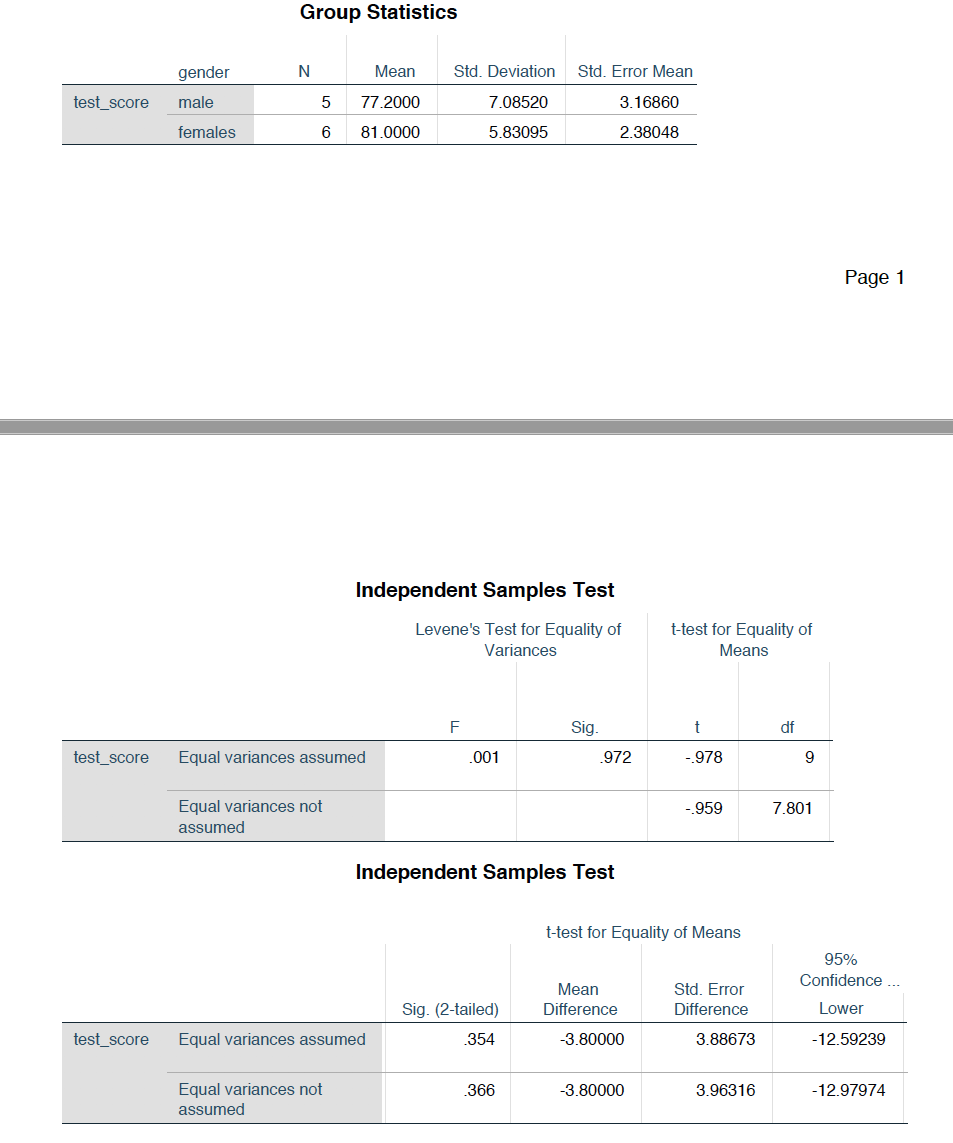
Transcribed Image Text:Group Statistics
gender
Mean
Std. Deviation
Std. Error Mean
test_score
male
77.2000
7.08520
3.16860
females
6
81.0000
5.83095
2.38048
Page 1
Independent Samples Test
Levene's Test for Equality of
t-test for Equality of
Variances
Means
F
Sig.
t
df
test_score
Equal variances assumed
.001
.972
-978
Equal variances not
-.959
7.801
assumed
Independent Samples Test
t-test for Equality of Means
95%
Confidence ...
Mean
Std. Error
Sig. (2-tailed)
Difference
Difference
Lower
test_score
Equal variances assumed
.354
-3.80000
3.88673
-12.59239
Equal variances not
.366
-3.80000
3.96316
-12.97974
assumed
Expert Solution
This question has been solved!
Explore an expertly crafted, step-by-step solution for a thorough understanding of key concepts.

This is a popular solution!

Trending now
This is a popular solution!

Step by step
Solved in 3 steps

Knowledge Booster


Learn more about
Need a deep-dive on the concept behind this application? Look no further. Learn more about this topic, statistics and related others by exploring similar questions and additional content below.Recommended textbooks for you
Glencoe Algebra 1, Student Edition, 9780079039897…
Algebra
ISBN:
9780079039897
Author:
Carter
Publisher:
McGraw Hill
Glencoe Algebra 1, Student Edition, 9780079039897…
Algebra
ISBN:
9780079039897
Author:
Carter
Publisher:
McGraw Hill